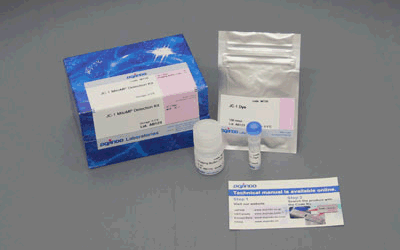
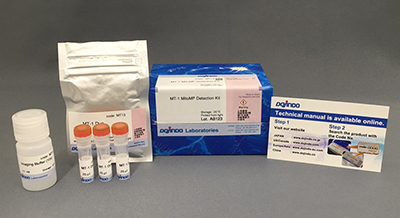
Extracellular OCR Plate Assay Kit
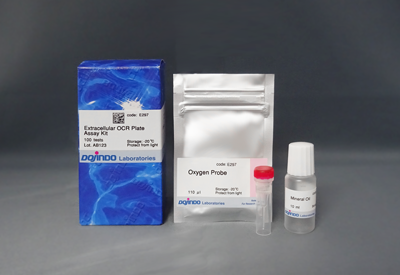
Oxygen Consumption Rate(OCR) Plate Assay Kit
- Applicable to regular fluorescent plate reader with temperature-controlled incubation
- No need for an expensive instrument, special medium, and plates
- All-in-One Kit with OCR calculation Sheets
-
Product codeE297 Extracellular OCR Plate Assay Kit
| Unit size | Price | Item Code |
|---|---|---|
| 100 tests | Find your distributors | E297-10 |
| 300 tests | Find your distributors | E297-12 |
Note:
|
|
A plate reader with temperature-controlled incubation is required to measure oxygen consumption. |
| 100 tests | ・Oxygen Probe ・Mineral Oil |
110 µl×1 10 ml×1 |
|---|---|---|
| 300 tests |
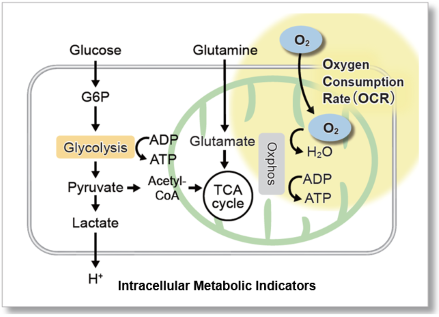
OCR is an Important Indicator for Mitochondrial Function
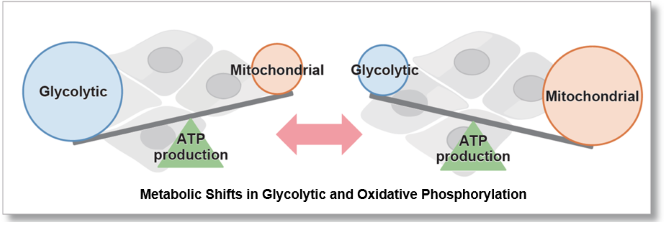
Since oxygen is consumed mainly in the process of adenosine triphosphate (ATP) production by mitochondrial oxidative phosphorylation, its oxygen consumption rate (OCR) is an indicator for the analysis of mitochondrial function. It is known that cancer cells produce ATP using the glycolytic pathway, which is less efficient than oxidative phosphorylation. It is also known that in immune cells, the predominance of oxidative phosphorylation inhibits anti-tumor effects, whereas the predominance of the glycolytic pathway promotes anti-tumor effects. As an indicator of their energy metabolism, the OCR of cells has been measured.
Manual
How to use the Mineral Oil
Technical info
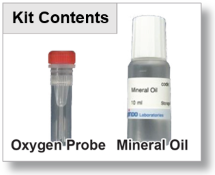
The Extracellular OCR Plate Assay Kit includes an Oxygen Probe, which has the property of increasing phosphorescence intensity as the oxygen concentration in the medium decreases, and Mineral Oil blocks the influx of oxygen from the air.
After measuring the phosphorescence intensity according to the extracellular oxygen concentration with a fluorescent microplate reader, the OCR of the cells is calculated (automatic calculation sheet) based on the Stern-Volmer equation.

*This product was commercialized under the guidance of Dr. Toshitada Yoshihara of Gunma University.
Comparison with Existing Method
Until now, OCR measurement required expensive devices such as flux analyzers and plate readers with time-resolved functions, as well as optional functions for plate readers, periments. This kit is recommended for those who are just starting experiments, as it can be used with a regular fluorescent microplate reader and comes a complete package of all necessary reagents.
| Dojindo Laboratories Extracellular OCR Plate Assay Kit |
Company A's Product | Company B's Instrument | |
|---|---|---|---|
| Instrument | Fluorescence Microplate Reader (Temperature control function is needed) |
Time-Resolved Fluorescence Microplate Reader (Temperature control function is needed) |
Flux Analyzer |
| Principle | Phosphorescence | Phosphorescence | Phosphorescence |
| Wavelength | Ex=500 nm / Em=650 nm | Ex=380 nm / Em=650 nm | Ex=532 nm / Em=650 nm |
| Required Special Reagents |
No | No | Special Plates, Special Medium |
| Added Reagents | 1 type/ well | 1 type/ well | Up to 4 types/ well (Continuous adding) |
| Assay Category | OCR | OCR | OCR & hydrogen ion concentrations |
Comparison with Flux Analyzer
Flux Analyzer (XFe24) and this kit were measured on the same day under the same conditions (cell type, cell number, and FCCP concentration).
As a result, correlated data of oxygen consumption rate changes were obtained for XFe24 and this kit.
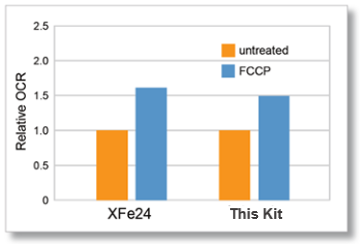
Cells: HepG2
Cell Number: 5×10⁴ cells/well
Stimulation: FCCP (Carbonyl cyanide 4-(trifluoromethoxy)phenylhydrazone)
FCCP Concentration: 2 μmol/l
Application Data: Evaluation of Maximum Respiratory Capacity of Cells
In HepG2 cells, the maximal respiration of cells was evaluated from the change in OCR values upon FCCP stimulation.
OCR was measured at 2 µmol/l and 4 µmol/l of FCCP. A decrease in OCR was observed at 4 µmol/l compared to 2 µmol/l, indicating maximal respiration at 2 µmol/l of FCCP.
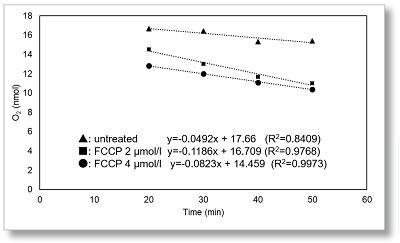
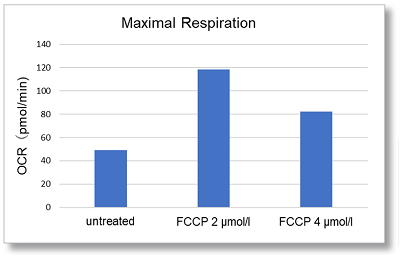
Cells: HepG2
Cell Number: 5×10⁴ cells/well
Stimulation: FCCP
FCCP Concentration: 2, 4 μmol/l
Application Data: Inhibition of Mitochondrial Electron Transport Chain
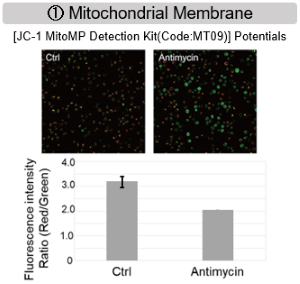
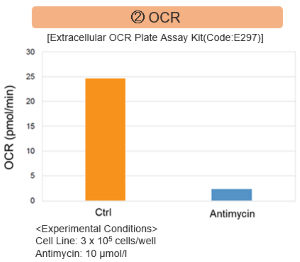
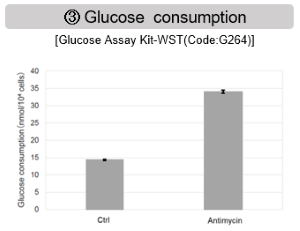
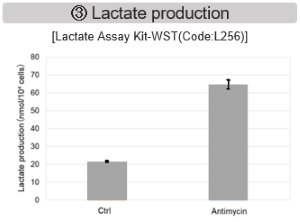
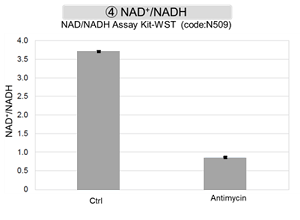
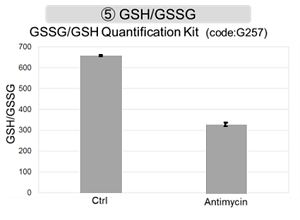
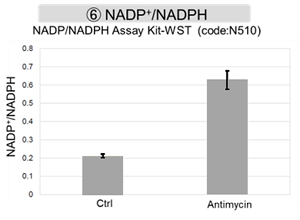
Antimycin stimulation of Jurkat cells was used to evaluate the changes in cellular state upon inhibition of the mitochondrial electron transport chain using a variety of indicators.
The results showed that inhibition of the electron transport chain resulted in (1) a decrease in mitochondrial membrane potential and (2) a decrease in OCR. In addition, (3) the NAD+/NADH ratio of the entire glycolytic pathway decreased due to increased metabolism of pyruvate to lactate to maintain the glycolytic pathway, (4) GSH depletion due to increased reactive oxygen species (ROS), and (6) increase in the NADP+/NADPH ratio due to decreased NADPH required for glutathione biosynthesis were observed.
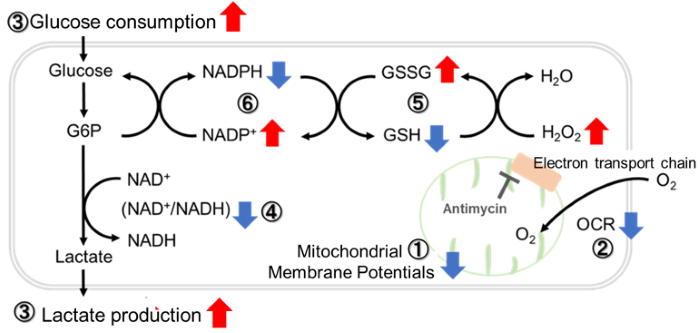
Application Data: Comparison of metabolic pathway dependence in different cell lines
Many cancer cells produce ATP through the glycolytic pathway. On the other hand, it has been recently reported that cancer cells whose glycolytic pathway is suppressed survive by shifting their energy metabolism to OXPHOS by enhancing mitochondrial function, and the dependency of metabolic pathways differs depending on cell lines.
The dependence of OXPHOS and Glycolysis in two types of cancer cells, HeLa and HepG2, were compared based on Lactate production, ATP levels, and OCR values.
<Evaluation by Lactate production and ATP levels>
We confirmed the changes in ATP and Lactate production when ATP synthesis by OXPHOS was inhibited by Oligomycin stimulation and by 2-Deoxy-D-glucose (2-DG) in the glycolytic pathway. The results showed that HeLa cells depend on Glycolysis and HepG2 cells depend on OXPHOS to synthesize ATP.
*Please refer to the "Supplementary information on technology and products used" section on the right for additional information on the results.
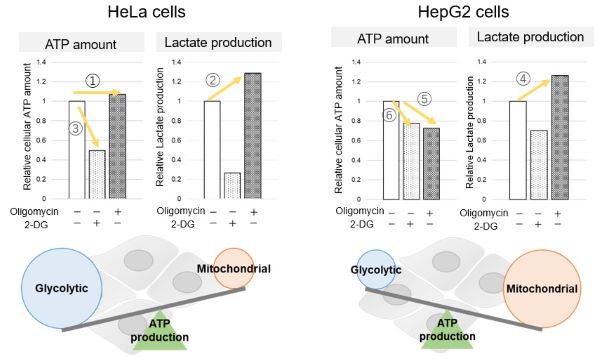
Evaluated with: Glycolysis/OXPHOS Assay Kit (Code: G270)
<Evaluation by OCR value>
Using the same number of cells, we measured the OCR value when cellular oxygen consumption was promoted by stimulating the cells with FCCP, a mitochondrial uncoupling agent. The results showed that HepG2 cells had higher OCR values than HeLa cells, suggesting a greater dependence on OXPHOS, correlating with the results obtained from ATP level and Lactate production.
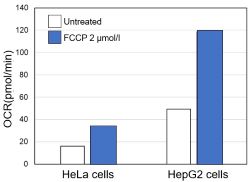
〈Experimental Condtions〉
Cell line: HeLa, HepG2
Cell number: 5×10⁴ cells/well
Stimulation: FCCP
Concentration: 2 μmol/l
Evaluated with: Extracellular OCR Plate Assay Kit (Code: E297)
Supplementary information on technology and products used
<Evaluation by Lactate production and ATP levels>
When OXPHOS was inhibited in HeLa cells, ATP levels remained unchanged (①), and lactate production increased (②). This suggests that even when OXPHOS is inhibited, glycolysis can be further activated. Conversely, when glycolysis is inhibited, ATP levels decrease significantly (③), indicating that energy production depends on glycolysis. On the other hand, when OXPHOS was inhibited in HepG2 cells, lactate production increased (④), indicating that the cells attempt to compensate for energy production by enhancing glycolysis, but ATP levels still decrease (⑤). This means that even with increased glycolysis, ATP production is not sufficiently compensated. Furthermore, ATP levels decrease more when glycolysis is inhibited (⑥), suggesting that energy production in HepG2 cells depends more on OXPHOS than glycolysis.
References
| Reference No. | Sample | Citation |
|---|---|---|
| 1 | Cell (HepG2) |
K. Saito, et al, "Obesity-induced metabolic imbalance allosterically modulates CtBP2 to inhibit PPAR-alpha transcriptional activity", J. Biol. Chem., 2023, doi:10.1016/j.jbc.2023.104890. |
| 2 | Cell (NIH3T3-L1) |
S. Oki, S. Kageyama, Y. Morioka and T. Namba, "Malonate induces the browning of white adipose tissue in high-fat diet induced obesity model", Biochem Biophys Res Commun., 2023, doi:10.1016/j.bbrc.2023.08.054. |
| 3 | Cell (Primary Hepatocyte) |
S. Tsuno, K. Harada, M. Horikoshi, M. Mita, T. Kitaguchi, M. Y. Hirai, M. Matsumoto and T. Tsubo , 'Mitochondrial ATP concentration decreases immediately after glucose administration to glucose-deprived hepatocytes', FEBS Open Bio, 2023, doi:10.1002/2211-5463.13744. |
| 4 | Sperm | P. S. Sushadi, M. Kuwabara, E. E. W. Maung, M. S. M. Mohtar, K. Sakamoto, V. Selvaraj and A. Asano, "Arresting calcium-regulated sperm metabolic dynamics enables prolonged fertility in poultry liquid semen storage", Sci. Rep., 2023, doi:10.1038/s41598-023-48550-2. |
Q & A
-
Q
How many samples can be tested by this kit?
-
A
24 samples can be measured when the same number of cells of one cell type is tested.
*If more than two cell types or multiple cell numbers are used in an experiment, separate Blanks and Controls must be prepared, and the number of samples that can be measured will vary. For details, please refer to the examples of plate layouts according to the manual.
-
Q
Is there any applications for floating cells?
-
A
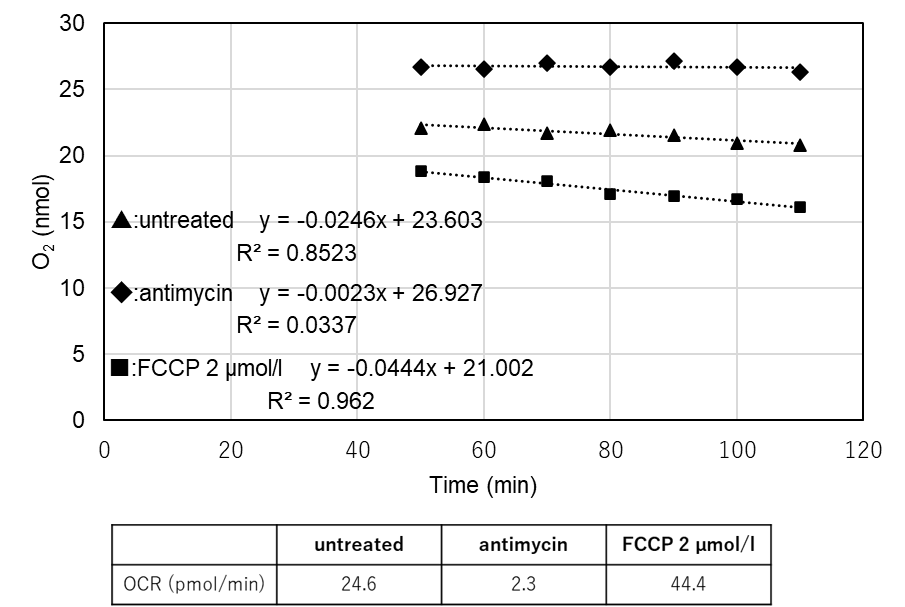
We prepared an example of Jurkat cells experiment.
<Protocol>
(1) Jurkat cells (3.0×10⁶ cells/ml) were suspended in RPMI medium as Blank 3 and Jurkat cells (3.0×10⁶ cells/ml) were suspended in working solution as Control or Sample. The cells were seeded in 100 µl (300,000 cells/well) in 96-well black clear-bottom microplates.
(2) 100 µl of RPMI medium was added to Blank 1 and 100 µl of working solution to Blank 2.
(3) Microplates were placed in a plate reader pre-set at 37°C and incubated for 30 minutes.
(4) Add 10 µl of RPMI medium to each of Blank 1, Blank 2, Blank 3, and Control.
(5)Sample solution (Antimycin or FCCP solution) diluted with RPMI medium was added to Sample in 10 µl portions.
(6) One drop of Mineral Oil was added to each well immediately after the addition of the Sample solution.
(7) The microplate was placed in a plate reader set at 37°C and incubated for 5 minutes.
(8)Intensities were measured with a fluorescent plate reader every 10 min for 200 min on a time course (Ex: 500 nm, Em: 650 nm, Bottom reading).
(9) OCR values were calculated by entering the intensity values obtained into a downloaded dedicated Excel calculation sheet.Amounts of sample and reagent required for each well.

<Result>
-
Q
Please tell me how to calculate OCR with this kit.
-
A
Please use the Excel Calculation Sheet and follow the instructions below.
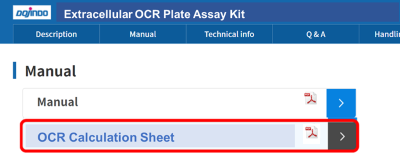
<Outline of OCR calculation procedure>
(1) Input the intensity values obtained from the OCR measurement into the calculation sheet, and the oxygen content (nmol) is automatically calculated using the Stern-Volmer formula.
(2) From the graph of time (min) vs. oxygen content (nmol), check the range of linearity obtained for all conditions measured.
(3) Calculate the slope over the range of time (min) and oxygen content (nmol) confirmed in step(2).
(4) Calculate OCR (pmol/min) from the slope calculated in step (3).
For details, please refer to "Analysis" in the manual.
-
Q
Why temperature-controllable plate readers are highly recommended for this kit?
-
A
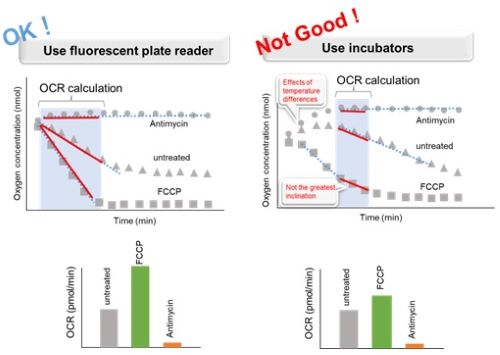
If the microplate is incubated with an incubator (or heat block, thermostatic chamber, etc.) after adding reagents and Mineral Oil, the temperature difference in the plate reader will affect the OCR result. This leads to a decrease in data reproducibility. Therefore, please use a temperature-controllable plate reader.
<General Protocol>

Step 3 and 7 for floating cells; Step 5 and 9 for adherent cells in the manual.<Effect of incubation environment on results>
-
Q
Does Mineral Oil have cytotoxicity to cells?
-
A
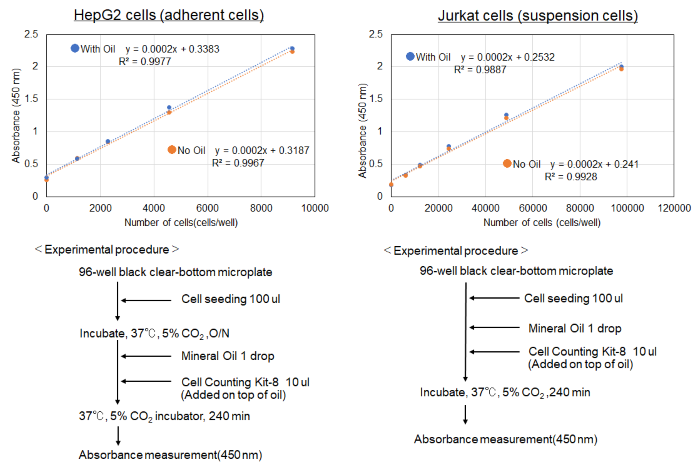
No toxicity was observed in cells treated with Mineral oil when measured by Cell Counting Kit-8 cytotoxicity assay.
(Reference)
-
Q
How to measure the cell number after OCR assay
-
A
Using nucleic acid probe (Code: H342)Hoechst 33342 to measure the cell number per well, here is an example of the protocol.
<Protocol>
(1) Seed cells into the wells for OCR measurement (liquid volume: 100 μl/well).
(2) Cells prepared for calibration curve preparation were seeded into the wells (liquid volume: 100 μl/well).
(3) OCR was measured according to the instruction manual.
(4) Add 10 µl/well of medium to the wells for calibration (to align the volume of medium to 110 µl/well with that of the wells for OCR measurement).
(5) Hoechst 33342 solution (10 µg/ml) diluted with the medium was added to all wells at 100 µl/well.
*Wells for OCR measurement was added from the top of the oil.
(6) Incubated at 37°C for 30 minutes.
(7) Measured with a fluorescence plate reader (Ex: 350 nm, Em: 461 nm ).
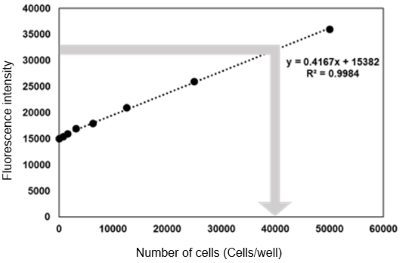
(8) A calibration curve (X-axis: number of cells, Y-axis: fluorescence intensity) was prepared and the number of cells in the wells for OCR measurement was calculated.
-
Q
Can I store the working solution for a long period of time?
-
A
The Working solution cannot be stored. Prepare it as needed.
-
Q
Will repeated freezing and thawing of Oxygen Probe or Mineral Oil affect the assay?
-
A
We have confirmed that repeated freeze-thaw cycles of Oxygen Probe and Mineral Oil have no effect on the assay.
-
Q
There is no difference in OCR values between control and drug-treated samples. What factors could be contributing to this?
-
A
Please check the following three experimental conditions.
(1) Temperature at time of measurement
(2) Number of cells
(3) Properties of the cells
(1) Temperature at time of measurement
If the temperature varies during measurement, it may affect the OCR result. Please make sure the following two steps are performed exactly according to the manual.
・The Mineral Oil, medium, and medium-diluted sample solutions should be preheated to around 37°C before use.
・After adding the reagent and Mineral oil, please use a temperature-controllable plate reader to incubate.
Please refer to the FAQ "Why temperature-controllable plate readers are highly recommended for this kit?".(2) Number of cells
Optimizing the cell number before the final examination is recommended.
If the number of cells is unsuitable, the difference between the experimental and control groups may not be significant. Please refer to the following.【How to pre-examination】
1. Pre-test with 1, 2 and 4 µM FCCP added to different cell numbers. Since the range of optimal cell numbers is narrow, it is recommended to prepare detailed cell number conditions such as 5, 7, 10 (×104) cells/well. The FCCP used by us and the method of adjustment are as follows, Manufacturer: Cayman Chemical
Product name: FCCP
Product code: 15218
How to use: 10 mM DMSO stock solution was prepared and diluted with medium. 2. Calculate the Relative OCR (Treated/Untreated) from the OCR (pmol/min) for each condition by plotting a graph (x=time, y=nmol of oxygen) from the fluorescence intensity values obtained on the calculation sheet downloaded from the E297 product page.
3. Decide on the optimum number of cells that meets the following two conditions from the obtained Relative OCR and graphical data.
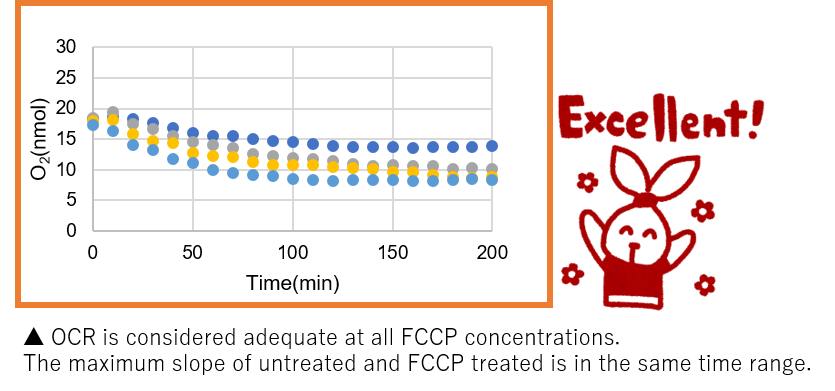
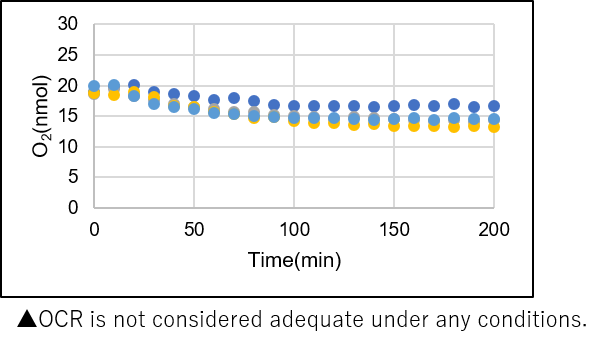
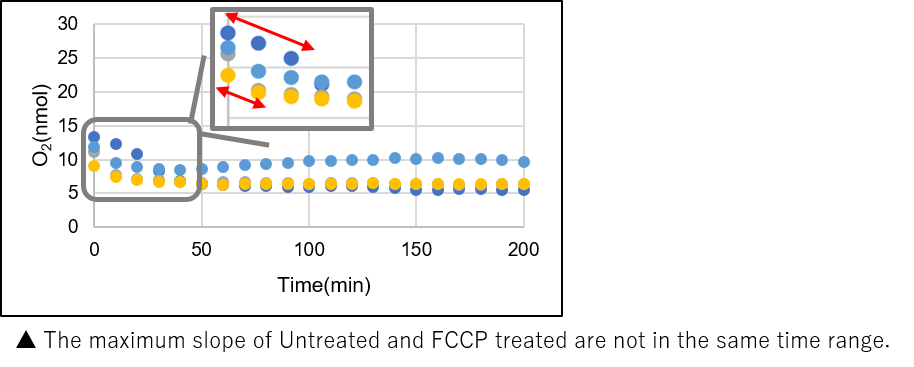
➀ The maximum slope (OCR) of the graph is sufficiently high and the maximum OCR of Untreated and FCCP are in the same time range. (Refer to ‘How to decide a collect slope’ below).
➁ Relative OCR is close to 2 for any of the 1, 2 or 4uM FCCPs.【How to decide a correct slope】
【Experimental example: Evaluation of optimal cell numbers in HEK293 cells 】
The following cell numbers were used to evaluate optimal cell numbers in HEK293 cells.
Please open the tabs to access the data for each cell number.〇Results with the optimal number of cells
Number of cells: 7.0×10⁴ cells/well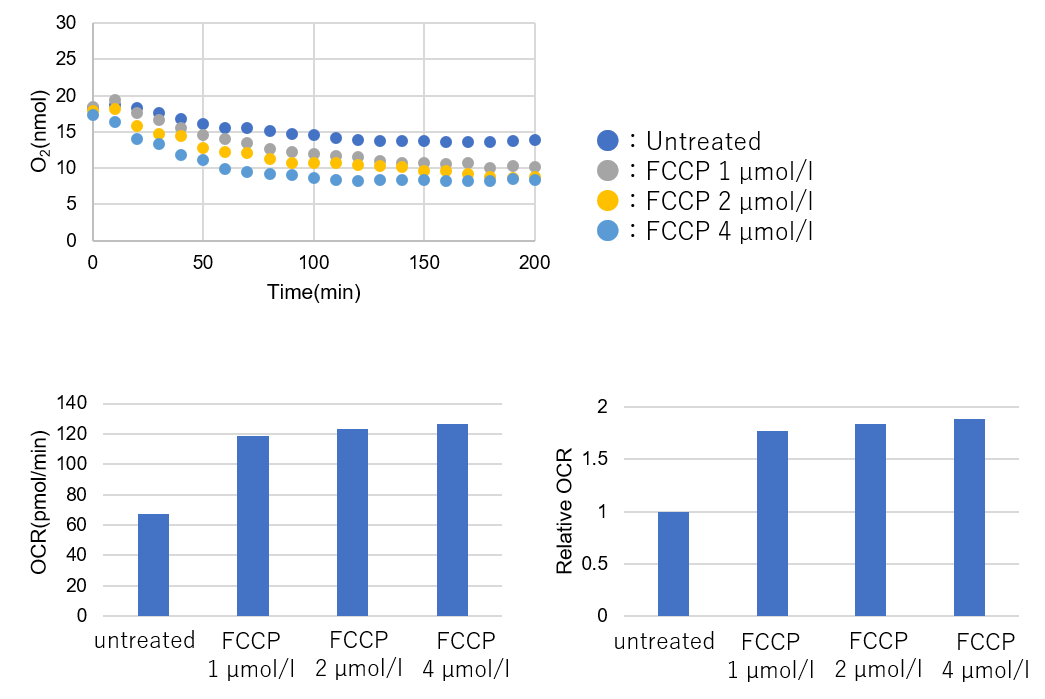
➀ OCR was considered to be adequate at all FCCP concentrations. The maximum slope of Untreated and FCCP treated were in the same time range.
➁ Relative OCR: Max. around 1.8.*Cells seeded in a 96-well plate were confluent when observed under the microscope.
→ It can be assumed that this is the optimum number of cells for HEK293 cells. Use this number of cells to obtain the desired experiment.〇Results with the lower number of cells
Number of cells: 5.0×10⁴ cells/well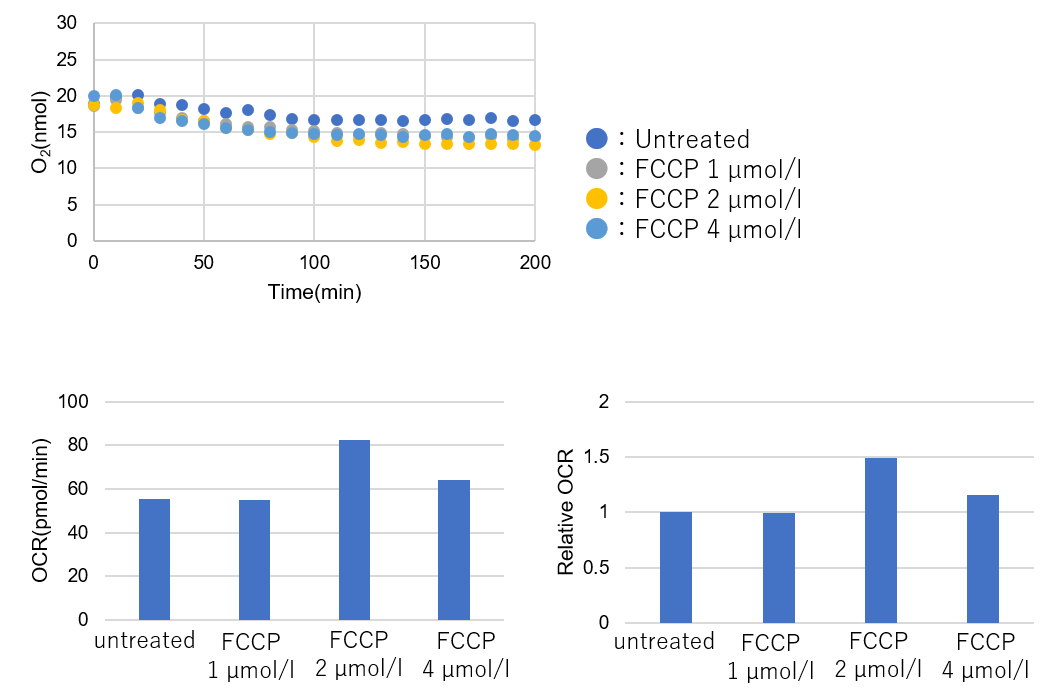
➀ OCR was not considered adequate under any conditions.
➁ Relative OCR: Max. around 1.5.*Cells seeded in a 96-well plate were not confluent when observed under the microscope.
→Increase the number of cells and measure the OCR.〇Results with the higher number of cells
Number of cells: 2.0×10⁵ cells/well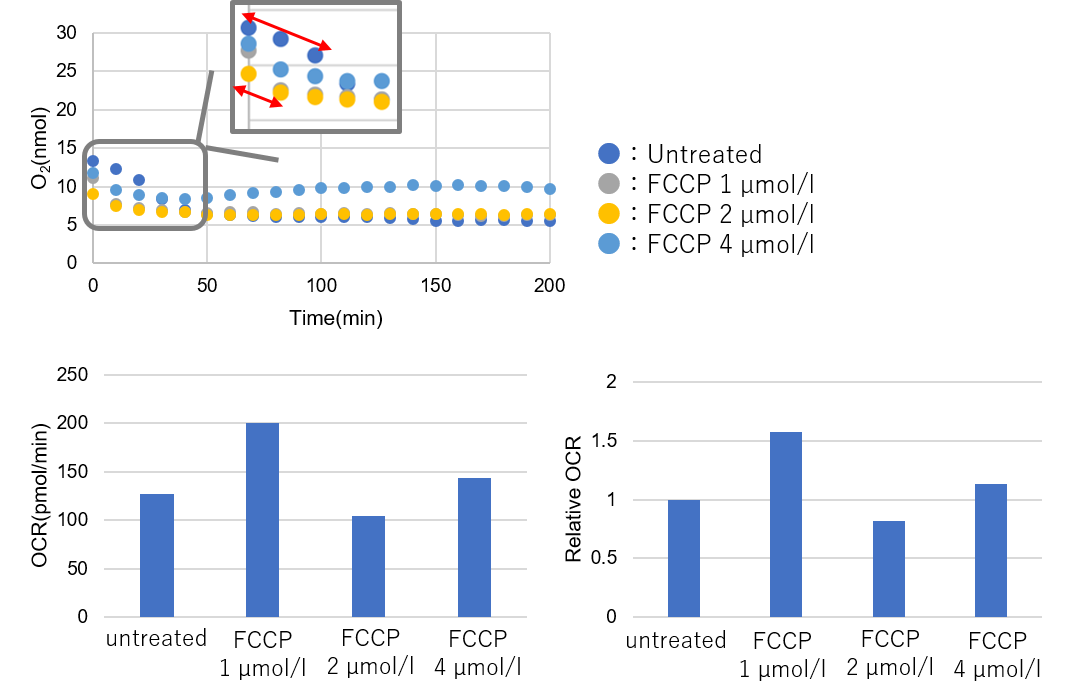
➀ OCR of Untreated and FCCP are not in the same time range.
➁ Relative OCR: Max. around 1.5.*This cell number is incorrect. There is no difference between untreated and FCCP.
(3) Properties of the cells
If there is no difference (or a small difference) between the OCR values after checking 1) and 2), there may be one of the following possibilities.
・The respiration rate of target cells is low. Non-cancer cell lines tend to have a lower OCR than cancer cells.
・Target cells are highly dependent on the glycolytic system for energy production.(Reference)
When comparing the OCR of two types of cancer cells (HeLa cells and HepG2 cells), HeLa cells, which are highly dependent on the glycolytic system for energy production, showed a lower OCR value compared to HepG2 cells.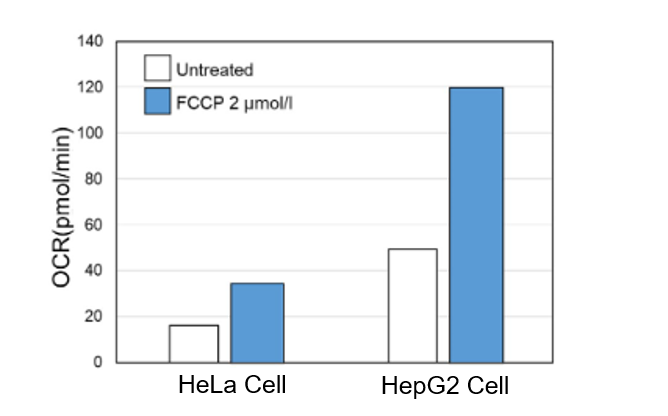
For information on how to identify the dependency of a metabolic pathway on a cell type, please click here.
Handling and storage condition
| Store at -20 °C, protect from light |


