

Cellular Senescence: Review and Reagent Selection Guide

Cellular senescence research guide

Detect senescent cells.
Explore what changes
inside them.

From senescence markers to ROS, mitochondrial function, lysosomal activity and metabolic remodeling—find the methods and assays that fit your research question.
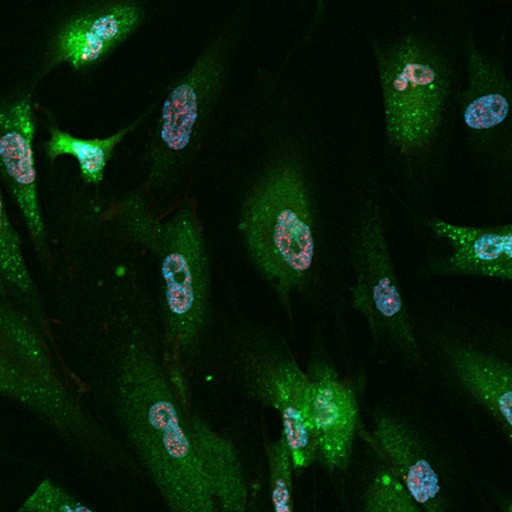
SPiDER-βGal, γ-H2AX and DAPI co-staining in fixed cells
SPiDER-βGal (green), γ-H2AX (red) and DAPI (blue) in fixed cells.
Data from the SG04 product page ↗

What Do You Want to Learn about Senescent Cells?

01 / Start with your research question

Cellular senescence can be studied from several angles. Begin with the question you need to answer, then select complementary markers and functional assays.

Q1Are my cells senescent?

Start with SA-β-gal activity, then assess stable cell-cycle arrest and additional features suited to your model.

See 03 - How to detect and confirm senescent cells ↓
Q2How are cellular functions changing?

Explore ROS, mitochondria, lysosomes / autophagy, and metabolic remodeling.

See 04 - Functional changes associated with cellular senescence ↓
Q3Which assays should I combine?

See established application data and practical workflows for multi-parameter analysis.

See 05 - Practical senescence research workflows ↓

What Is Senescence?

02 / Understand the biology

Cellular senescence is a stress-responsive cellular state frequently associated with stable cell-cycle arrest, altered lysosomal activity, changes in metabolism and context-dependent secretory programs. Its roles can be beneficial or detrimental depending on the biological setting.

Identify

Senescence-associated markers

Assess markers linked to growth arrest, SA-β-gal activity, DNA damage, morphology, and secretory phenotype. Use orthogonal evidence rather than relying on one readout.

Characterize

Senescence-associated functional changes

Understand what happens after or alongside senescence induction, including changes in oxidative stress / redox balance, mitochondrial function, lysosomes / autophagy, and metabolism. These measurements explain phenotype and mechanisms, but do not establish senescence on their own.

See 04 - Functional changes associated with cellular senescence ↓
Important for interpretation: No single marker is universally specific for cellular senescence. Marker selection and biological interpretation must account for cell type, induction method, and experimental context. In tissue studies, expert guidelines recommend evidence from multiple senescence characteristics (Suryadevara et al., 2024; Ogrodnik et al., 2024).

How to Detect and Confirm Senescent Cells

03 / First, identify the phenotype

Senescent cells are identified by combining several independent features. SA-β-gal activity is the most widely used readout and a practical place to start, but confirm it with evidence of stable cell-cycle arrest and other features suited to your model.

Find an SA-β-gal method for your experiment

Select your sample, its state and your instrument to see the recommended product.

Sample
Sample state
Instrument
Tissue samples are analyzed by microscopy.

Recommended for this combination

SG04Cellular Senescence Detection Kit - SPiDER-βGal

Single-cell green fluorescence imaging of SA-β-gal in living cells.

Bafilomycin A1 is included for the live-cell protocol.

Product details ↗
SG04Cellular Senescence Detection Kit - SPiDER-βGal

Quantify the percentage of SA-β-gal-positive cells by flow cytometry.

Bafilomycin A1 is included for the live-cell protocol.

Product details ↗
SG05Cellular Senescence Plate Assay Kit - SPiDER-βGal

Measure SA-β-gal activity in many samples with a plate reader.

Cells are lysed for the readout, so the result is a well average, not individual cells.

Product details ↗
SG07Cellular Senescence Detection Kit - SPiDER Blue

Blue fluorescence leaves the green and red channels free for co-staining, including immunostaining.

Product details ↗
SG04Cellular Senescence Detection Kit - SPiDER-βGal

Green fluorescence detection that also works with fixed cells.

For fixed cells, prepare pH 6.0 McIlvaine buffer separately.

Product details ↗
SG07Cellular Senescence Detection Kit - SPiDER Blue

Blue fluorescence for multicolor flow cytometry (Pacific Blue channel).

Product details ↗
SG04Cellular Senescence Detection Kit - SPiDER-βGal

Green fluorescence detection that also works with fixed cells.

For fixed cells, prepare pH 6.0 McIlvaine buffer separately.

Product details ↗
SG07Cellular Senescence Detection Kit - SPiDER Blue

Plate reader detection of SA-β-gal in fixed cells.

Product details ↗
SG02SPiDER-βGal

Fluorescent probe for SA-β-gal imaging in tissue, such as frozen sections.

Reagent only, not a kit. Fixation can lower β-gal activity, so optimize the fixation conditions.

Product details ↗

Which markers complement SA-β-gal?

SA-β-gal is a practical first readout, but it is not specific on its own. Confluent or starved cells can also stain positive. Combine it with independent features of senescence such as the markers below.

Readout What is measured Method / instrument What it tells you
p16 / p21 Protein or mRNA levels of CDK inhibitors p16INK4a and p21CIP1 Immunostaining (microscope)
Western blot
qPCR
Expression of CDK inhibitors associated with cell-cycle arrest.Increased expression supports senescence assessment but does not establish senescence on its own.
Ki-67 / EdU Ki-67 protein expression
or EdU incorporation during DNA synthesis
Ki-67 immunostaining or EdU labeling
(microscope, flow cytometer)
Reduced proliferative activity or DNA synthesis during the observation period.Negative results alone do not establish stable arrest or distinguish senescence from quiescence or differentiation.
γH2AX Phosphorylated histone H2AX
(nuclear foci or overall protein levels)
Immunofluorescence for foci (microscope)
Western blot for protein levels
Evidence consistent with DNA-damage signaling, including responses to double-strand breaks and replication stress.γH2AX is not specific to senescence.
SASP-related factors Secreted proteins such as IL-6, IL-8 and MMPs
or mRNA levels of corresponding genes
ELISA or multiplex assays for secreted proteins
(culture supernatant)
qPCR for mRNA (cells)
Changes in SASP-related factors.Profiles vary with cell type, inducer and time, and these factors are also produced by non-senescent cells. mRNA levels do not directly measure secretion.

Functional Changes Associated with Cellular Senescence

04 / Characterize the senescent state

After confirming the senescent phenotype, ask what is changing inside the cell. The four research themes below connect major senescence-related questions to measurable parameters and existing Dojindo methods.

Oxidative stress & redox balance

Does ROS production change during senescence?

Explore the relationship between cellular ROS, mitochondrial superoxide, DNA damage and antioxidant capacity.

MeasureTotal ROS · mtROS · GSH/GSSG

Mitochondrial dysfunction

Is mitochondrial function altered in senescent cells?

Investigate mitochondrial membrane potential, oxygen consumption, and mitochondrial quality control.

MeasureMembrane potential (ΔΨm) · Mitophagy · Oxygen consumption

Lysosome & autophagy

Does increased lysosomal activity mean normal lysosomal function?

Separate lysosomal staining, acidification and autophagic flux. An increase in SA-β-gal or lysosomal mass does not by itself demonstrate normal degradative capacity.

MeasureLysosomal pH · Organelle features · Autophagic flux

Explore Detection Methods

Metabolic remodeling

Are glycolysis and redox metabolism changing?

Examine NAD+/NADH balance and energy-pathway changes. Glycolysis and oxidative phosphorylation responses can differ among senescence models.

MeasureNAD+/NADH · Glycolysis/OXPHOS · Lactate

Explore Detections Methods

Science Notes are Dojindo's summaries of recent research. More topics are available in the Science Note back numbers ↗

Practical Workflows and Supporting Data

05 / Combine assays in practice

Explore published assay combinations and a suggested workflow for relating SA-β-gal activity to functional changes in senescence models.

Tested by Dojindo identifies combinations shown in Dojindo application data. Suggested workflow presents an assay combination supported by separate reference protocols. The links in each card lead to the relevant data or protocols. Same cells or Separate wells shows how the readouts are combined.

Seed senescent and control cells at a similar, subconfluent density before staining. Confluent cells can show false-positive SA-β-gal staining.

WORKFLOW 01
Tested by DojindoSame cells

SA-β-gal and oxidative stress

Detect SA-β-gal and total ROS in the same cells by flow cytometry.

Readouts

How

Stain live cells with Photo-oxidation Resistant DCFH-DA, fix with 4% PFA/PBS, then stain with SPiDER Blue. SPiDER Blue (blue) and DCFH-DA (green) are read in different channels.

WORKFLOW 02
Tested by DojindoSeparate wells

SA-β-gal and metabolic changes

Compare SA-β-gal with mitochondrial membrane potential and energy metabolism in the same senescence model.

Readouts

How

Prepare all samples from the same senescence model and measure each readout in its own wells. Use separate wells to avoid fluorescence overlap between JC-1 and SPiDER-βGal.

Protocols and data

WORKFLOW 03
Suggested workflowSeparate wells

SA-β-gal and lysosomal changes

Measure lysosomal mass and lysosomal pH alongside SA-β-gal, rather than treating lysosomal abundance as a single indicator of lysosomal function.

Readouts

How

Induce senescence in a culture dish, then reseed the cells into a 96-well plate. Measure SA-β-gal, lysosomal mass and lysosomal pH in separate wells.

Protocols and data

Product Classification

Product Classification