DAPGreen - Autophagy Detection
Autophagy (Autophagosome) Detection
- Quantitative Analysis by Plate Reader
- High Correlation with Autophagy Marker LC3
- No Need for Transfection
-
Product codeD676 DAPGreen - Autophagy Detection
| Unit size | Price | Item Code |
|---|---|---|
| 5.0 nmol | $452.00 | D676-10 |


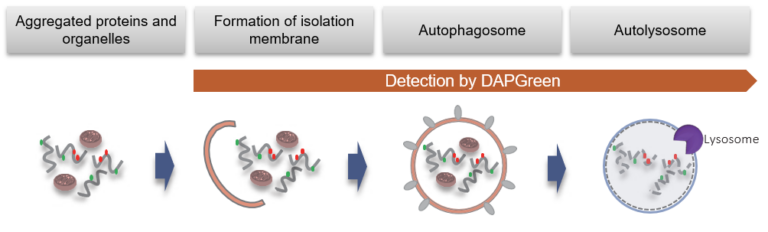
Detection Principle
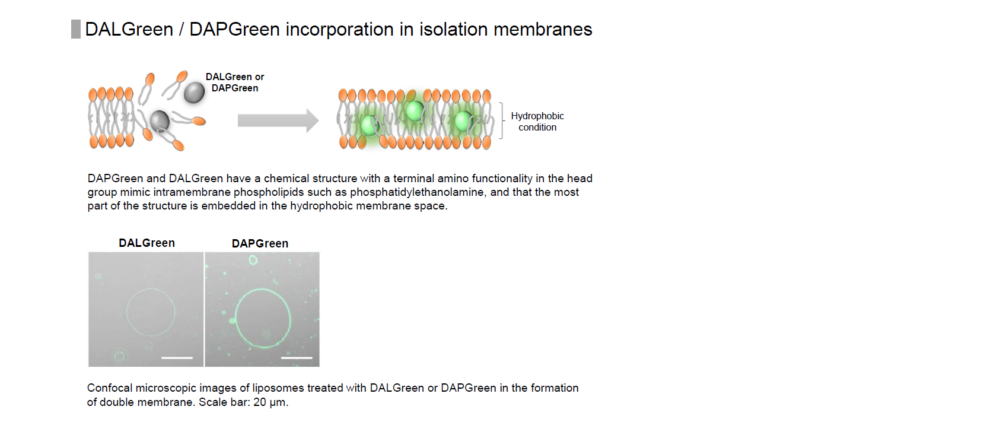
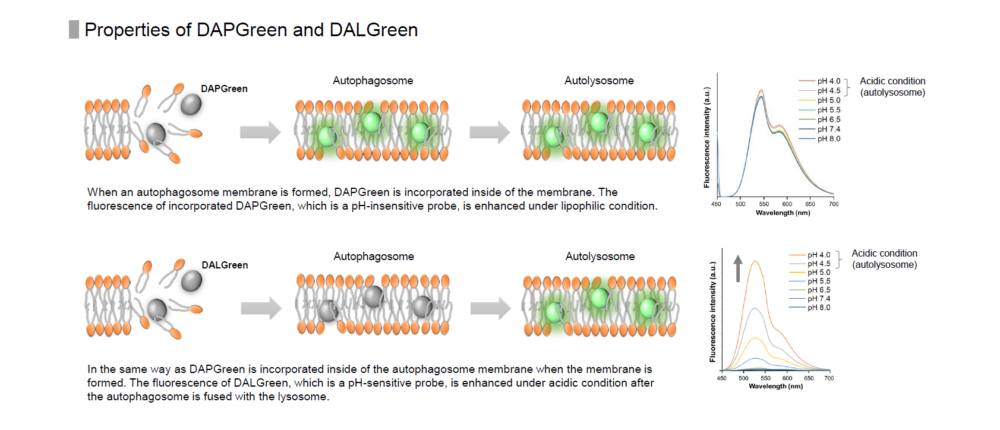
DAPGreen is used to detect autophagy in live cells. Autophagy is an intracellular degradation system, where dysfunctional proteins and organelles are degraded. In this process, aggregated dysfunctional proteins are surrounded by the double membrane to form an autophagosome. DAPGreen, is a small fluorescent molecule, detects autophagosomes and autolysosomes possibly by a mechanism that the dye is incorporated into autophagosome during double membrane formation due to structure features, and then emits fluorescence under hydrophobic conditions. DALGreen is cell permeable, has no requirement of transfection method, and enables live cell imaging with fluorescence microscopy and quantitative assay by flow cytometry. For monitoring autolysosome, DALGreen [D675] is recommend since it allows detection of phagosome-lysosome fusion.
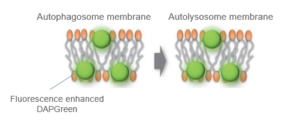
When an autophagosome membrane is formed, DAPGreen is incorporated inside of the membrane. The fluorescence of incorporated DAPGreen is enhanced under lipophilic condition. The analysis of DAPGreen also has a high correlation with that of LC3 which is a well-known autophagy marker. For details, please refer to the experimental data of DAPGreen.
Autophagy Analysis Products
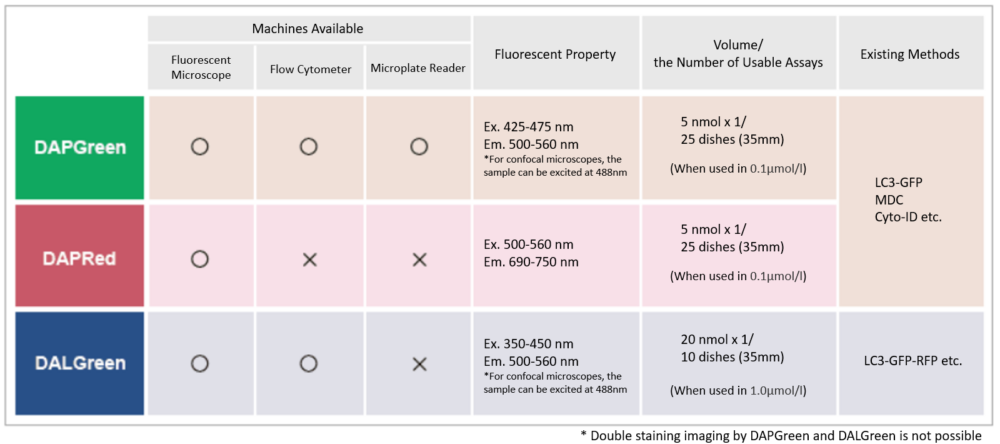
| Product Name | Autophagosome Detection Dyes and Fluorescence Properties |
Autolysosome Detection Dyes and Fluorescence Properties |
|---|---|---|
| Autophagic Flux Assay Kit* | DAPRed Ex: 500-560 nm / Em: 690-750 nm |
DALGreen Ex: 350-450 nm / Em: 500-560 nm |
| DAPGreen - Autophagy Detection | DAPGreen Ex: 425-475 nm / Em: 500-560 nm |
|
| DAPRed - Autophagy Detection | DAPRed Ex: 500-560 nm / Em: 690-750 nm |
|
| DALGreen - Autophagy Detection | DALGreen Ex: 350-450 nm / Em: 500-560 nm |
*Kit includes Lysosome Acidification Inhibitor


Manual
Technical info
Gene transfection is not necessary. You only need to add the reagent to your cell sample, and you can get a fluorescent image.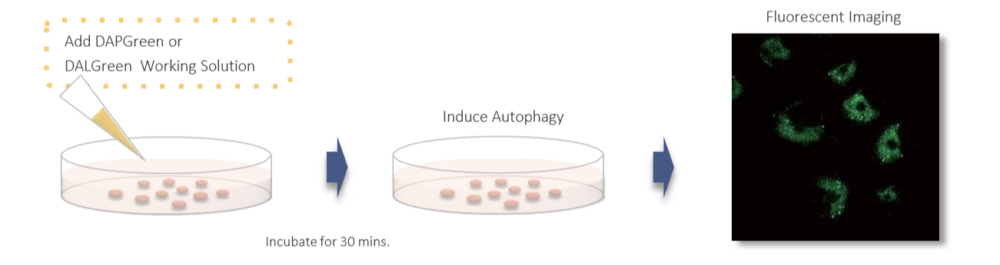
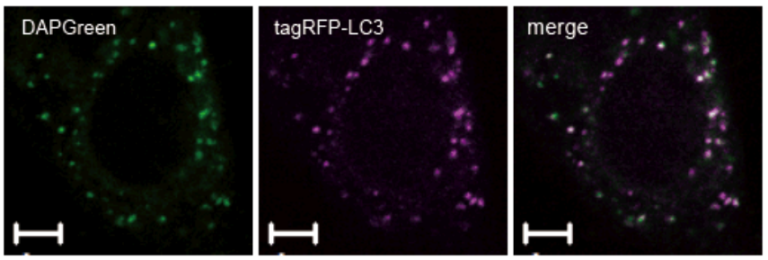
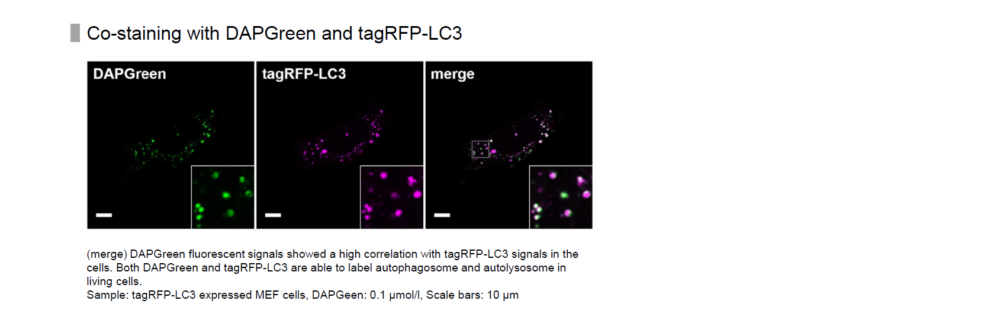
High Correlation with LC3
Result:
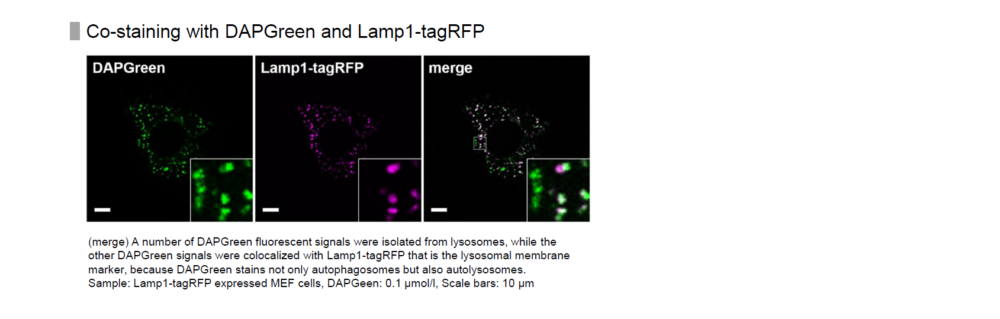
Almost all DAPGreen signals were colocalized with LC3.
Imaging Condition:
DAPGreen:Ex. 488 nm/Em. 500-563nm
Scale bar: 10 μm
The Condition of Autophagy Induction:
After adding DAPGreen to the RFP-LC3 expressed Hela cells, cells were treated with rapamycin to induce autophagy. Fluorescent imaging was conducted by confocal microscopy after 4 hrs. from autophagy induction.
Quantitative Analysis by Flow Cytometer
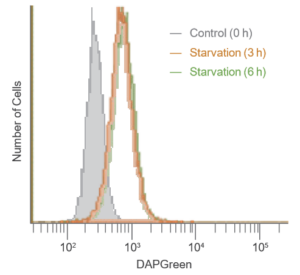
Result:
After 3 hrs. of incubation under starved condition, strong fluorescence was detected.
Detection:
Wavelengths: Ex. 488 nm / Em. 500-560 nm
The Condition of Autophagy Induction:
After staining with DAPGreen, HeLa cells were incubated for 0, 3, 6 hrs. with amino acid-free medium and detected by a flow cytometer.
Quantitative Analysis by Microplate Reader
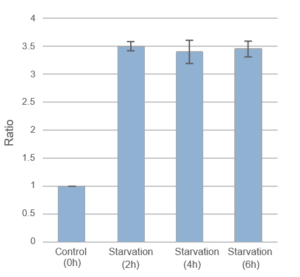
Result:
After 2hrs. of incubation under starved condition fluorescence was observed. It was ca. 3,5 times stronger than “Control”.
Detection:
Wavelengths: Ex. 450nm/ Em. 535nm
The Condition of Autophagy Induction:
After staining with DAPGreen, HeLa cells were incubated for 0, 2, 4, 6 hrs. with amino acid-free medium and detected by a microplate reader.
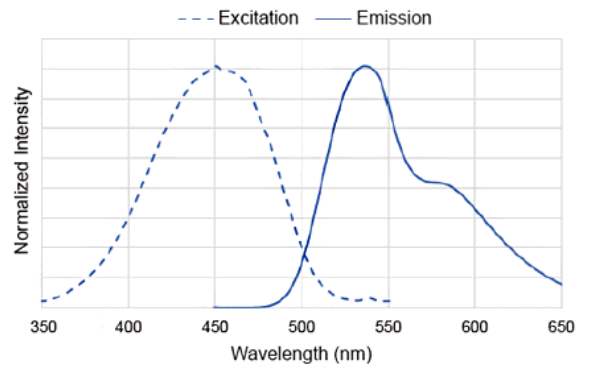
DAPGreen Excitation/Emission
Usage examples from Publications
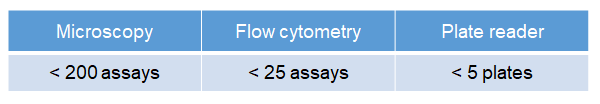
Microscopy: 250 μl /assay (8 well chamber slide)
Flow cytometry: 2,000 μl (6 well plate)
Plate reader: 100 μl/assay (96 well plate)
[Condition] ・Final concentration of DAPGreen working solution: 0.1 μmol/l
・The total volume prepared at 0.1 μmol/l DAPGreen working solution: 50 ml
NOTE: The number of assay depends on the final concentration of DAPGreen or volume of working solution.
Reagent Properties
H. Iwashita, H. T. Sakurai, N. Nagahora, M. Ishiyama, K. Shioji, K. Sasamoto, K. Okuma, S. Shimizu, and Y. Ueno, “Small fluorescent molecules for monitoring autophagic flux“, FEBS Lett., 2018, 592, (4), 559–567.
Some data mentioned on this page is provided by the reference above.
Related Product Information
Detection is possible with a fluorescent microscope, a flow cytometer and a microplate reader using DAPGreen and DAPRed [#D677]. DALGreen [#D675] detects autolysosome. After a lysosome fuses with the autophagosome, the environment in the autolysosome become acidic. DALGreen fluoresce stronger as acidity increases. DALGreen can be applied in two methods (a fluorescent microscope and a flow cytometer). Please select your most suitable method depending on your equipment.
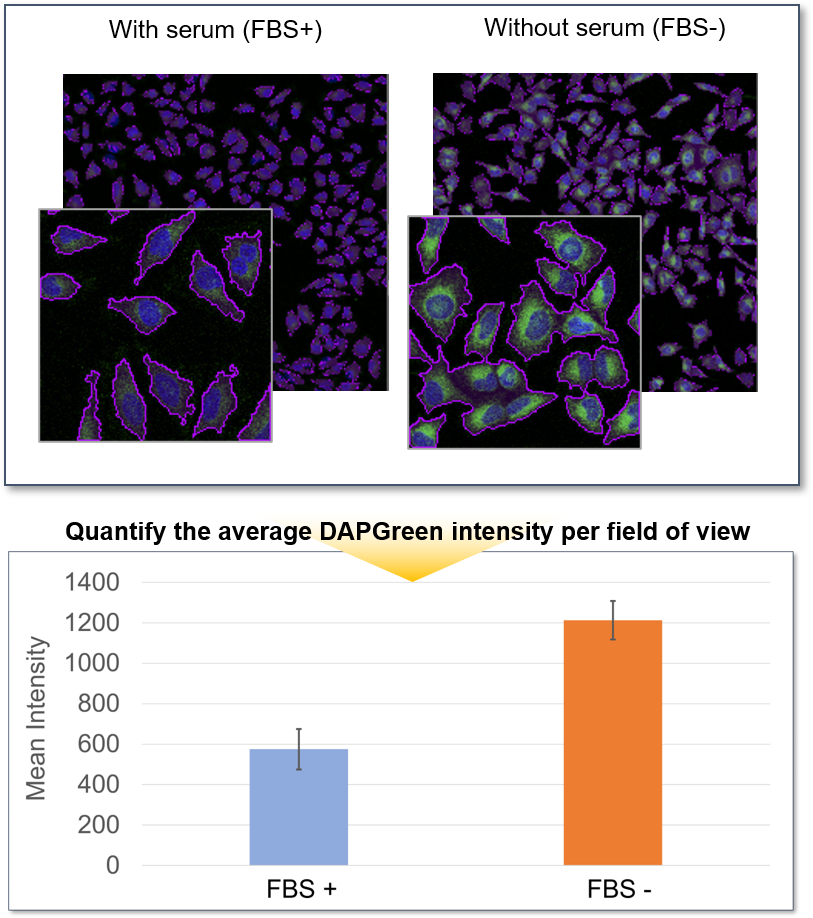
Quantification by fluorescence microscopy
HeLa cells in a 96-well plate were stained with DAPGreen. Then, autophagy was induced through serum starvation before being detected via fluorescence microscopy.
The mean fluorescent intensity (MFI) per field of view was then quantified, using the Nikon software NIS-Elements. The results indicated that the MFI was increased in the serum-free HeLa cells.
<Detection conditions>
Ex = 488 nm, Em = 500-550 nm
Microscope Objective Lens: CFI Plan Apochromat VC 20x
Operation: Resonant Scanning
Lateral resolution (x-y): 512 x 512
<Equipment>
Confocal Microscope: Nikon A1R
Software: NIS-Elements
<Procedure>
1. Prepare HeLa cells for the assay in 96-well microplates and incubate at 37oC for overnight.
2. Wash once with culture medium (with serum) after removing the supernatant.
3. Add DAPGreen working solution and incubate at 37oC for 30 minutes.
4. Wash twice with culture medium (with serum) after removal of supernatant.
5. Add medium (with or without serum) to the wells where autophagy is to be induced and incubate at 37oC for 6 hours.
6.Fix HeLa cells with 4% PFA and observe under a confocal microscope.
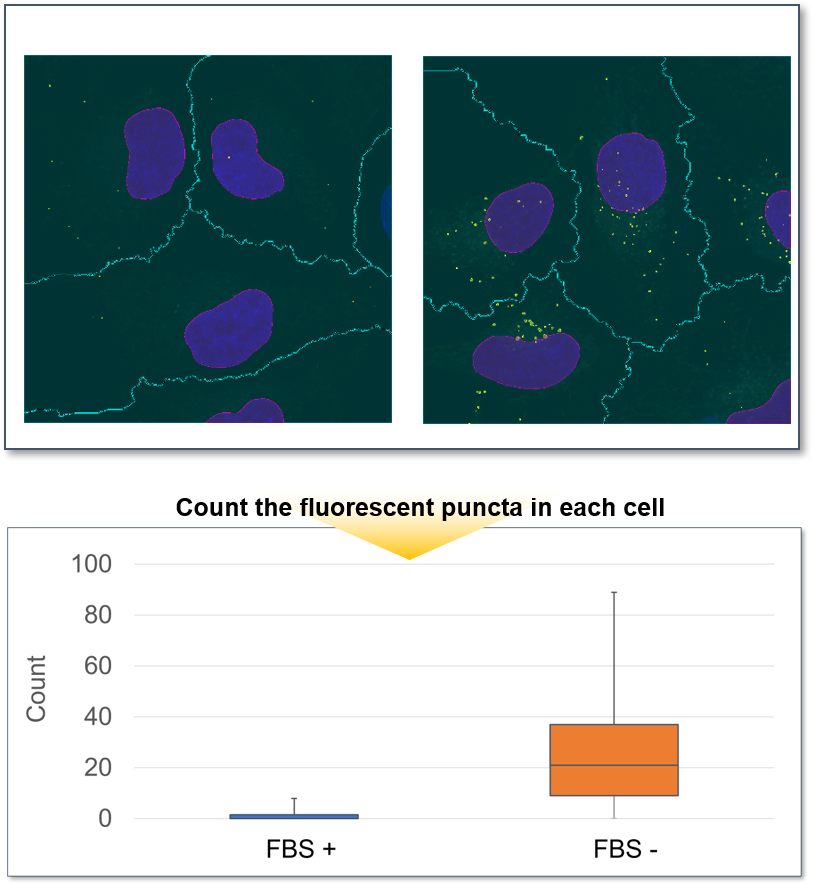
Furthermore, the cells were observed in more detail by switching to a 100X objective. The number of DAPGreen fluorescent puncta per cell were then counted, and an average of 27 puncta were detected in HeLa cells cultured in serum-free medium, while only the 1.5 fluorescent puncta per cell were detected with serum. This was a very significant increase compared to cells in serum-containing medium.
<Detection conditions>
Ex = 488 nm, Em = 500-550 nm
Microscope Objective Lens: CFI Apochromat TIRF 100xC Oil
Operation: Galvano Scanning
Lateral resolution (x-y): 512 x 512
<Equipment>
Confocal Microscope: Nikon A1R
Software: NIS-Elements
※This data was provided by the user.
References
| No. | Sample | Instrument | Reference(Link) |
| 1) | Cell (HeLa, MEF) |
Fluorescent Microscope |
H. Iwashita, H. T. Sakurai, N. Nagahora, M. Ishiyama, K. Shioji, K. Sasamoto, K. Okuma, S. Shimizu, and Y. Ueno, "Small fluorescent molecules for monitoring autophagic flux.", FEBS Letters., 2018, 592, (4), 559–567. |
| 2) | Cell (HepG2; Huh-7) |
Fluorescent Microscope; Flow Cytometer |
L. Hu, T. Zhang, D. Liu, G. Guan, J. Huang, P. Proksch, X. Chen and W. Lin, "Notoamide-type alkaloid induced apoptosis and autophagy via a P38/JNK signaling pathway in hepatocellular carcinoma cells", RSC Adv., 2019, 9, 19855. |
| 3) | Cell (HepG2) |
Fluorescent Microscope |
Q. Chu, S. Zhang, M. Chen, W. Han, R. Jia, W. Chen and X. Zheng, "Cherry Anthocyanins Regulate NAFLD by Promoting Autophagy Pathway", Oxid Med Cell Longev., 2019,DOI:10.1155/2019/4825949. |
| 4) | Cell (HLMVEC) |
Fluorescent Microscope |
K. Koike, E. V. Berdyshev, A. M. Mikosz, I. A. Bronova, A. S. Bronoff, J. P. Jung, E. L. Beatman, K. Ni, D. Cao, A. K. Scruggs, K. A. Serban and I. Petrache, "Role of Glucosylceramide in Lung Endothelial Cell Fate and Emphysema", Am. J. Respir. Crit. Care Med., 2019,DOI:10.1164/rccm.201812-2311OC. |
| 5) | Cell (HeLa) |
Fluorescent Microscope |
F. Hongbao,Y. Shankun, C. Qixin, L. Chunyan, C. Yuqi, G. Shanshan, B. Yang, T. Zhiqi, L. Z. Amanda, T. Takanori, C.Yuncong, G. Zijian, H. Weijiang and D. Jiajie , "De Novo-Designed Near-Infrared Nanoaggregates for Super-Resolution Monitoring of Lysosomes in Cells, in Whole Organoids, and in Vivo.", ACS Nano, 2019, 13, (12), 1446. |
| 6) | Cell (HeLa; A375) |
Flow Cytometer |
B. Yang, L. Ding, Y. Chen and J. Shi, "Augmenting Tumor-Starvation Therapy by Cancer Cell Autophagy Inhibition", Adv. Sci., 2020,DOI:10.1002/advs.201902847. |
| 7) | Cell (PC12) |
Fluorescence microscope (super-resolution) |
Y. Tan, L. Yin, Z. Sun, S. Shao, W. Chen, X. Man,Y. Du and Y. Chen, "Astragalus polysaccharide exerts anti-Parkinson via activating the PI3K/AKT/mTOR pathway to increase cellular autophagy level in vitro.", Int. J. Biol. Macromol., 2020, DOI:10.1016/j.ijbiomac.2020.02.282. |
| 8) | Cell (Wild type Hepa 1-6) |
Fluorescent Microscope (Quantified by ImageJ) |
Z. Peng, Y. Liao, X. Wang, L. Chen, L. Wang, C. Qin, Z. Wang, M. Cai, J. Hu, D. Li,P. Yao, A. K. Nüssler, L. Liu and W. Yang, "Heme oxygenase-1 regulates autophagy through carbon-oxygen to alleviate deoxynivalenol-induced hepatic damage.", Arch. Toxicol., 2020, 94(2), 573. |
| 9) | Cell (Mouse skin fibroblast) |
Flow Cytometer |
J. Kim, W.Y.Chee, N. Yabuta, K. Kajiwara, S. Nada and M. Okada, "Atg5-mediated autophagy controls apoptosis/anoikis via p53/Rb pathway in naked mole-rat fibroblasts", Biochem. Biophys. Res. Commun., 2020, 22, DOI:10.1016/j.bbrc.2020.05.083. |
| 10) | Cell (HeLa) |
Fluorescence microscope (super-resolution) |
Q. Chen, M. Hao, L. Wang, L. Li, Y. Chen, X. Shao, Z. Tian, R. A. Pfuetzner, Q. Zhong, A. T. Brunger, J. Guan and J. Diao, "Prefused lysosomes cluster on autophagosomes regulated by VAMP8", 2021, doi:10.1038/s41419-021-04243-0. |
Q & A
-
Q
How stable is DAPGreen working solution?
-
A
DAPGreen working solution cannot be stored and should be used up on the day it is prepared.
-
Q
How stable is DAPGreen DMSO stock solution?
-
A
The stock solution should be stored at -20°C in a light-shielded condition and is stable for 1 month after preparation.
For long storage, it is recommended to divide the solution into smaller portions.
-
Q
What excitation and emission conditions do you recommend?
-
A
Excitation: 425 - 475 nm
Emission: 500 - 560 nmWe have experience in fluorescence observation using a confocal microscope with 488 nm excitation.
Please refer to the examples of experiments on the product page of our website.
-
Q
Are there any precautions to take when performing time-lapse imaging?
-
A
Perform a preliminary experiment to set up the measurement conditions.
Due to the characteristics of the reagent, the initial fluorescence value tends to be high immediately after staining, so please perform preliminary experiments and time-lapse imaging by referring to the following procedures.(1) Preliminary experiment
・Use control cells (cells that do not induce autophagy).
・Stain cells with Working solution according to the instruction manual, and wash them twice with a culture medium.
・After adding a culture medium, observe the change in fluorescence over time.
・After staining, check the time when the fluorescence in the cells gradually decreases and then stabilizes (T in the figure).
Note: Conditions may vary depending on the cell type.(Reference)
In the case of HeLa cells, we have confirmed that the fluorescence intensity stabilizes after approximately 60 minutes of staining (DAPGreen).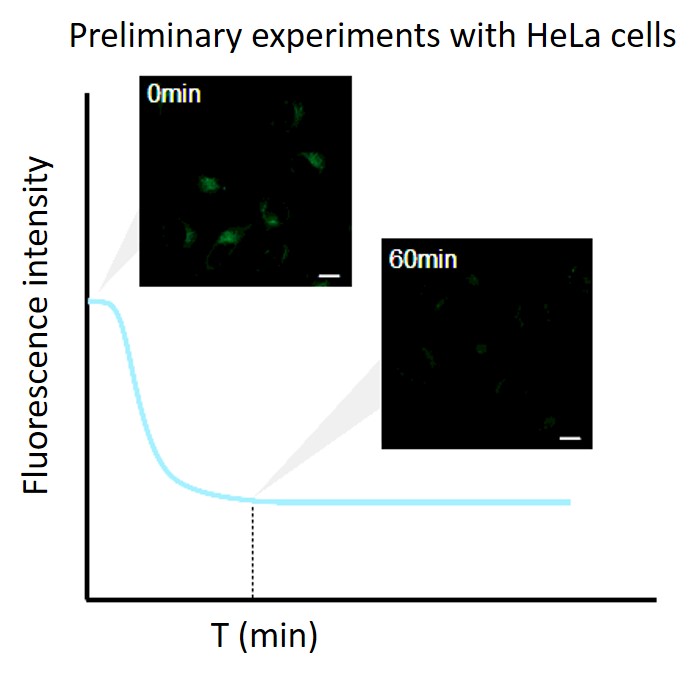
(2) Time-lapse imaging
・After staining cells with Working solution, incubate cells in a culture medium at 37°C.
Note 1: Incubate cells at 37°C in a culture medium for the time set in the preliminary experiment.
Note 2: Do not induce autophagy immediately after staining.・After incubation, start autophagy induction and perform time-lapse imaging.
(Reference)
HeLa cells were stained with DAPGreen and incubated in a culture medium for 60 minutes (time set in the preliminary experiment) before autophagy induction.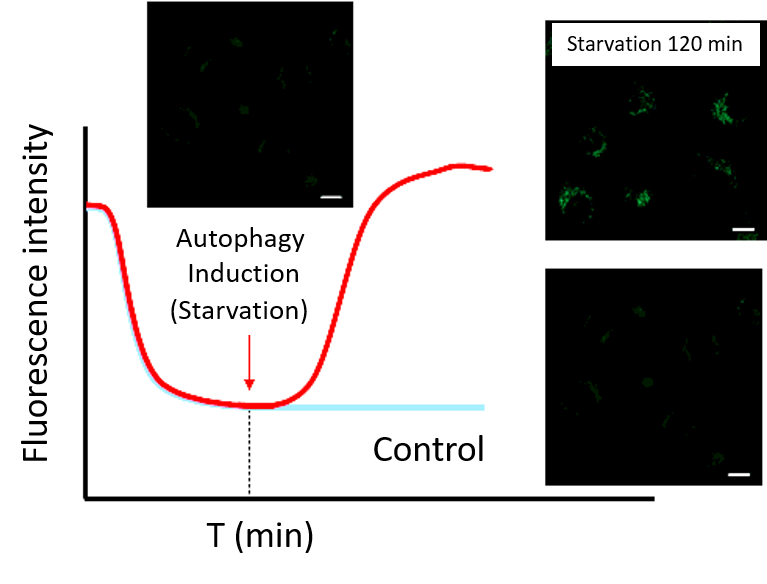
-
Q
How do I decide the optimal concentration of DAPGreen?
-
A
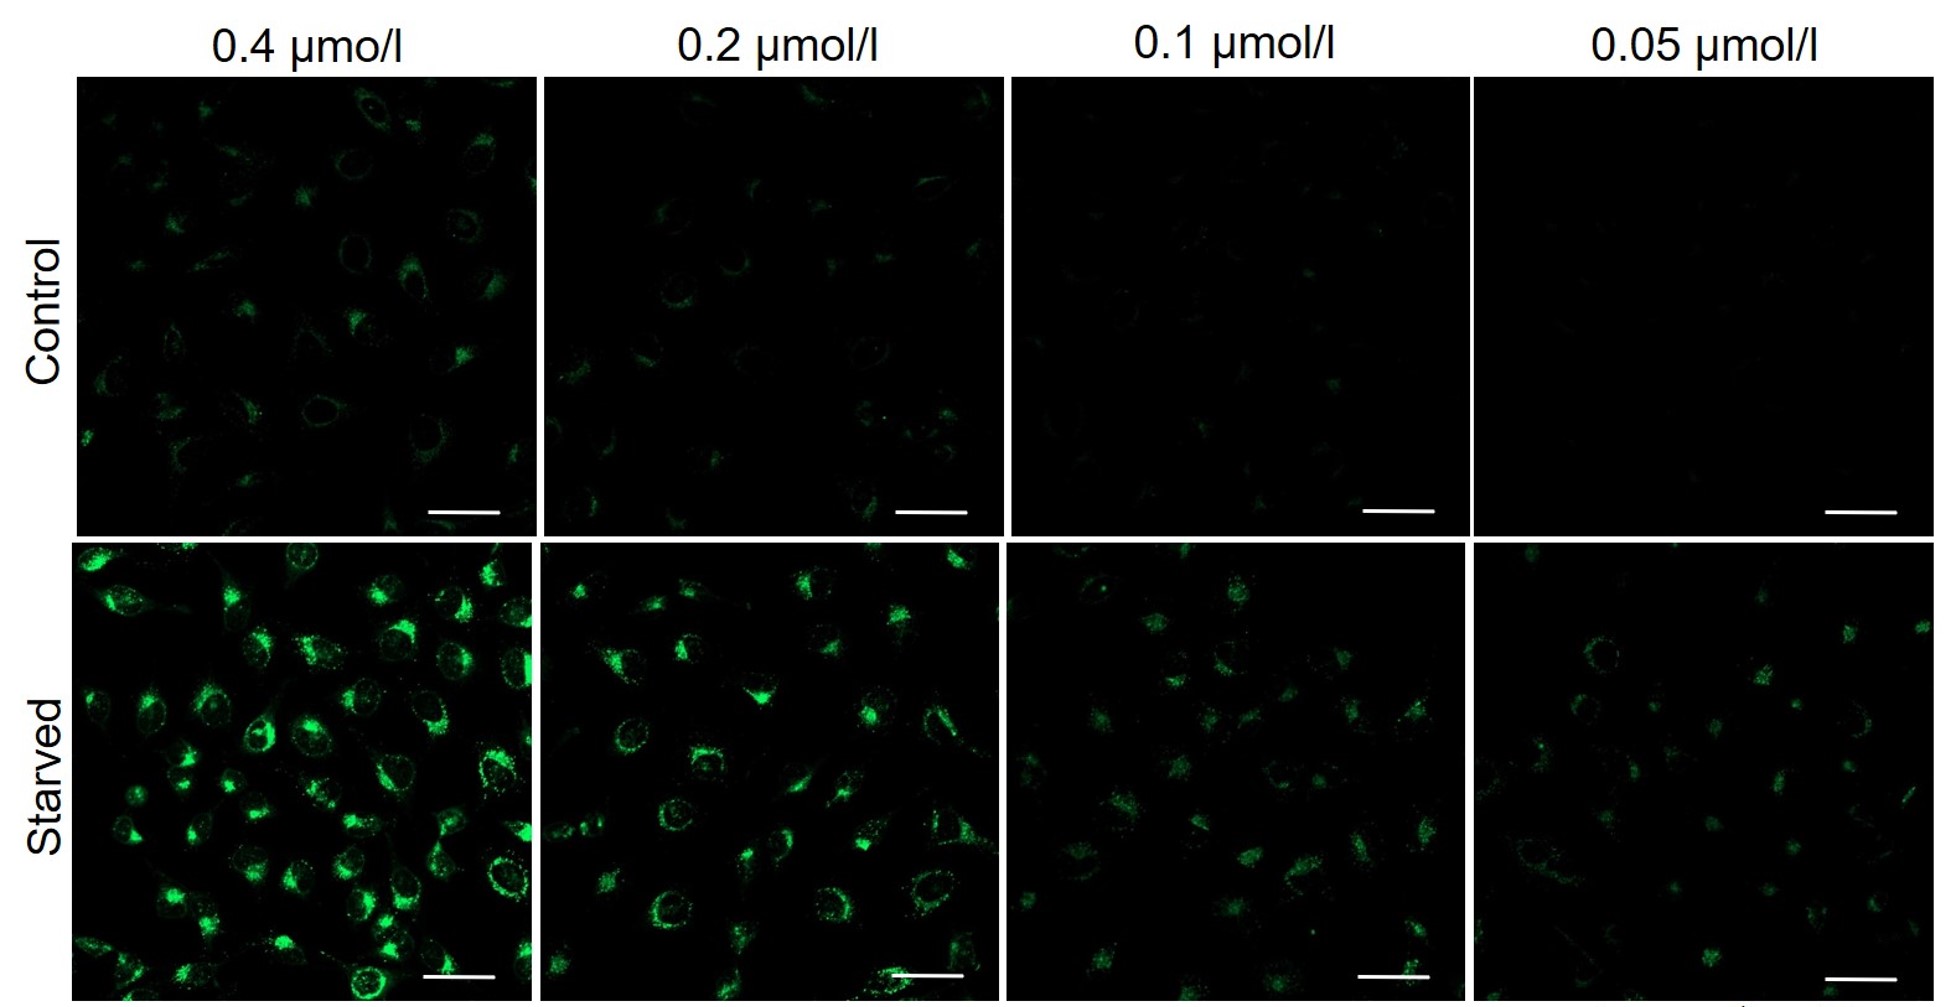
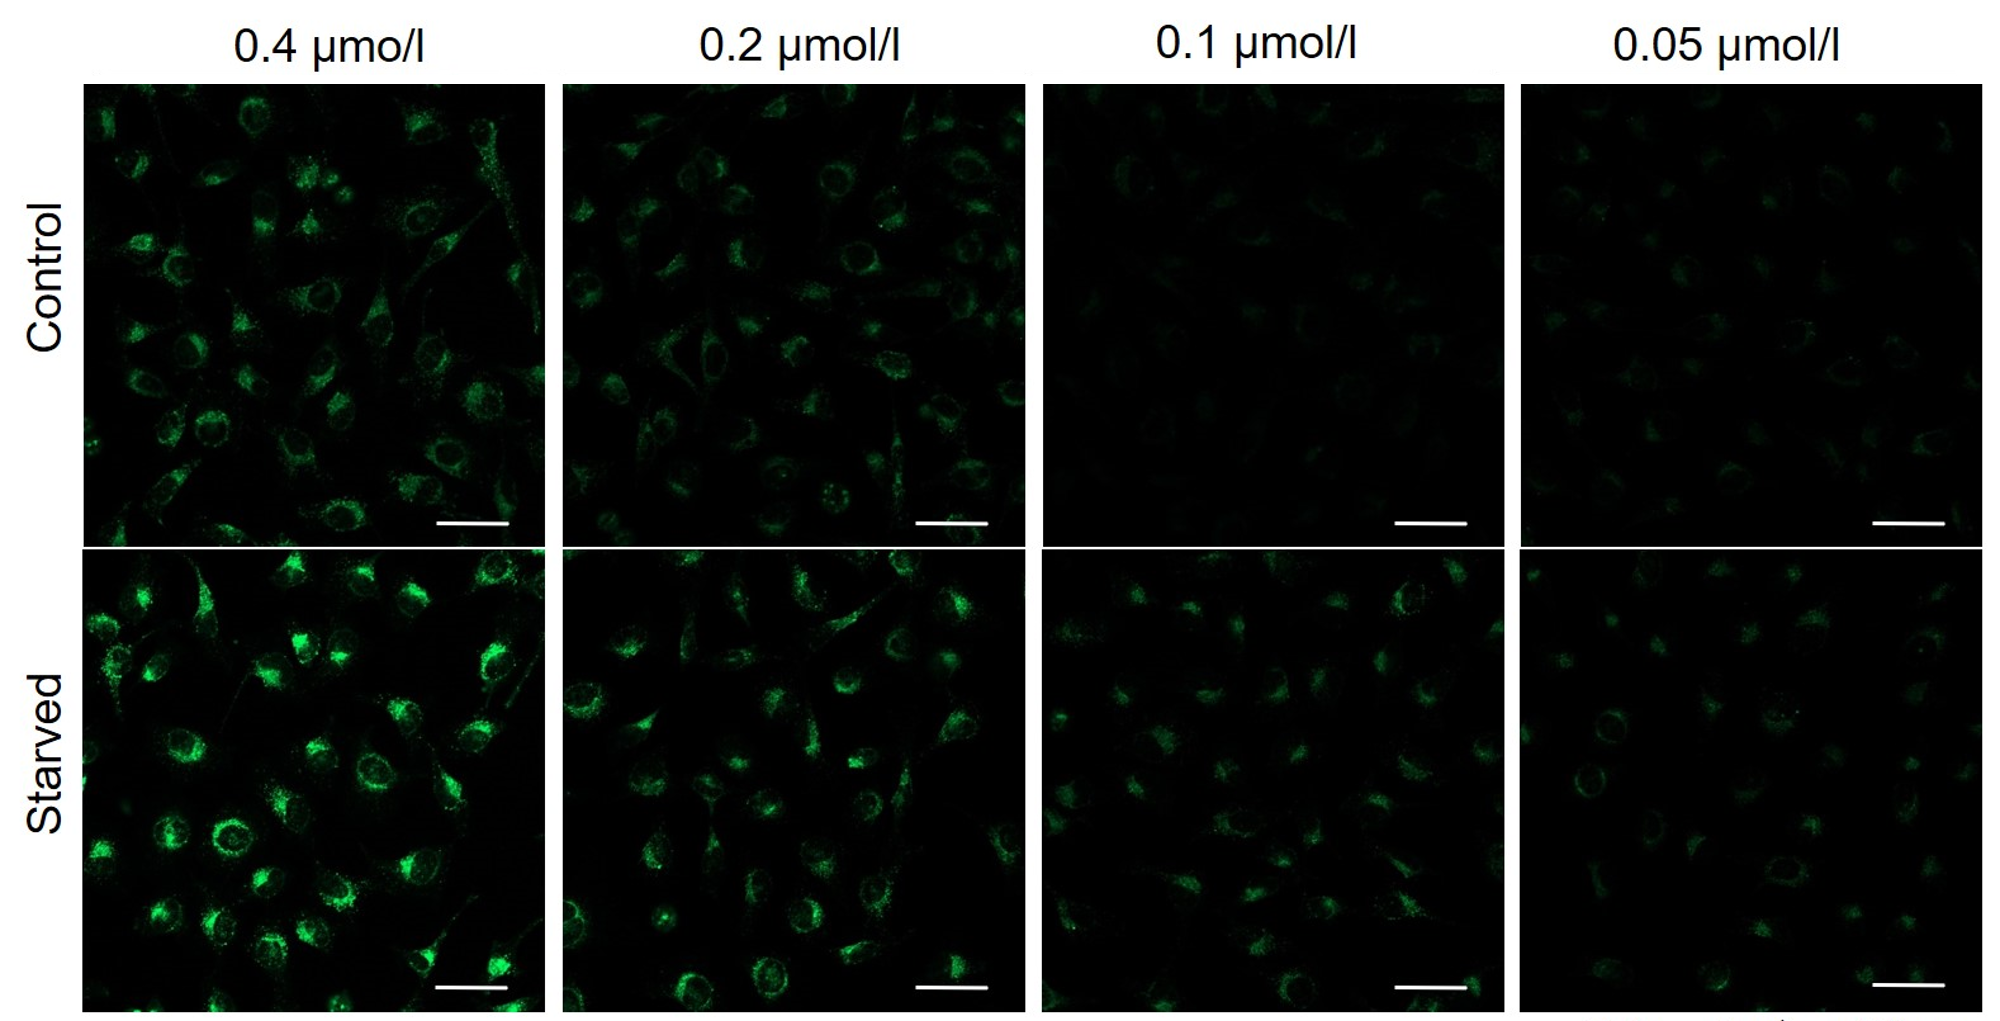
If the reagent concentration is too high or too low, it may be difficult to tell the difference between autophagy induction and uninduced control.
It is recommended to consider the reagent concentration concerning the following information.The optimal concentration of DAPGreen depends on the cell type.
Please consider increasing the concentration of DAPGreen in steps of several points starting from a low concentration (0.05 - 1 μmol/l is the approximate range).(Reference)
We have studied the optimal concentration of DAPGreen for each cell type in HeLa, HepG2, and CHO cells.
DAPGreen was stained at the following concentrations and cultured in an amino acid-free medium to induce autophagy.As a result, differences from the control were observed under the following concentration conditions highlighted in red.
Cell types Tested concentration HeLa 0.4 µmol/l, 0.2 µmol/l, 0.1 µmol/l, 0.05 µmol/l HepG2 0.4 µmol/l, 0.2 µmol/l, 0.1 µmol/l, 0.05 µmol/l CHO 0.4 µmol/l, 0.2 µmol/l, 0.1 µmol/l, 0.05 µmol/l HeLa
HepG2
CHO
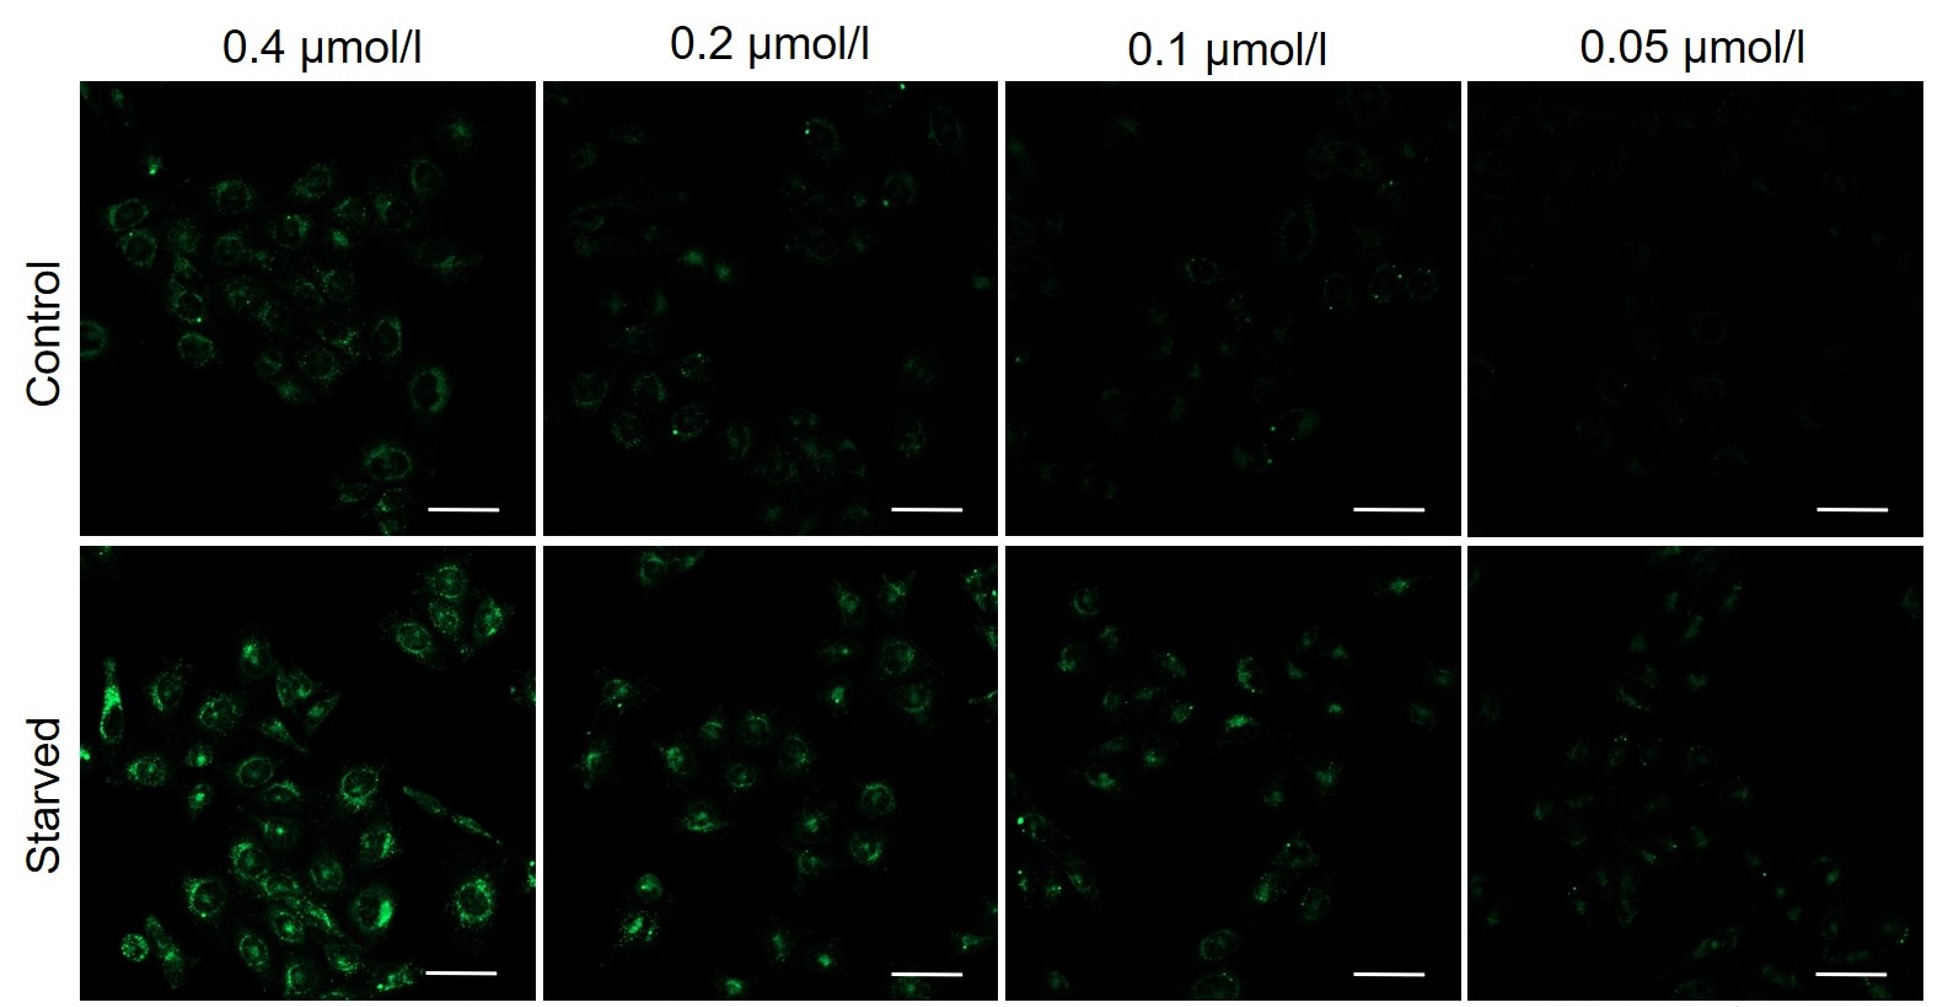
All Imaging Conditions:
DAPGreen: Ex. 488 nm/Em. 500-563 nm
Scale bar: 50 μm
-
Q
What are the measurement conditions for quantitative analysis in a plate reader?
-
A
An example of measurement using HeLa cells is shown below.
HeLa cells stained with DAPGreen are cultured in an amino acid-free medium for 0, 2, 4, and 6 hours, and then detected with a plate reader.
1) Seed cells on a clear bottom black plate (HeLa cells, 1.6 x 10^4 cells/well, 100 µl/well)
2) Incubate overnight (37°C, 5% CO2)
3) Remove the supernatant and add 100 µl of working solution (DAPGreen: 0.1 µmo/l) adjusted with medium.
4) Incubate at 37°C for 30 minutes (37°C, 5% CO2)
5) Wash with medium (100 µl x twice)
6) Add 100 µl of an amino acid-free medium (Fujifilm Wako Pure Chemicals, code: 048-33575)
7) Incubate at 37°C for each time.
8) Measured with a plate reader (TECAN, infinite pro M200) (Ex/Em=450/530nm)
(0min is measured by replacing with HBSS)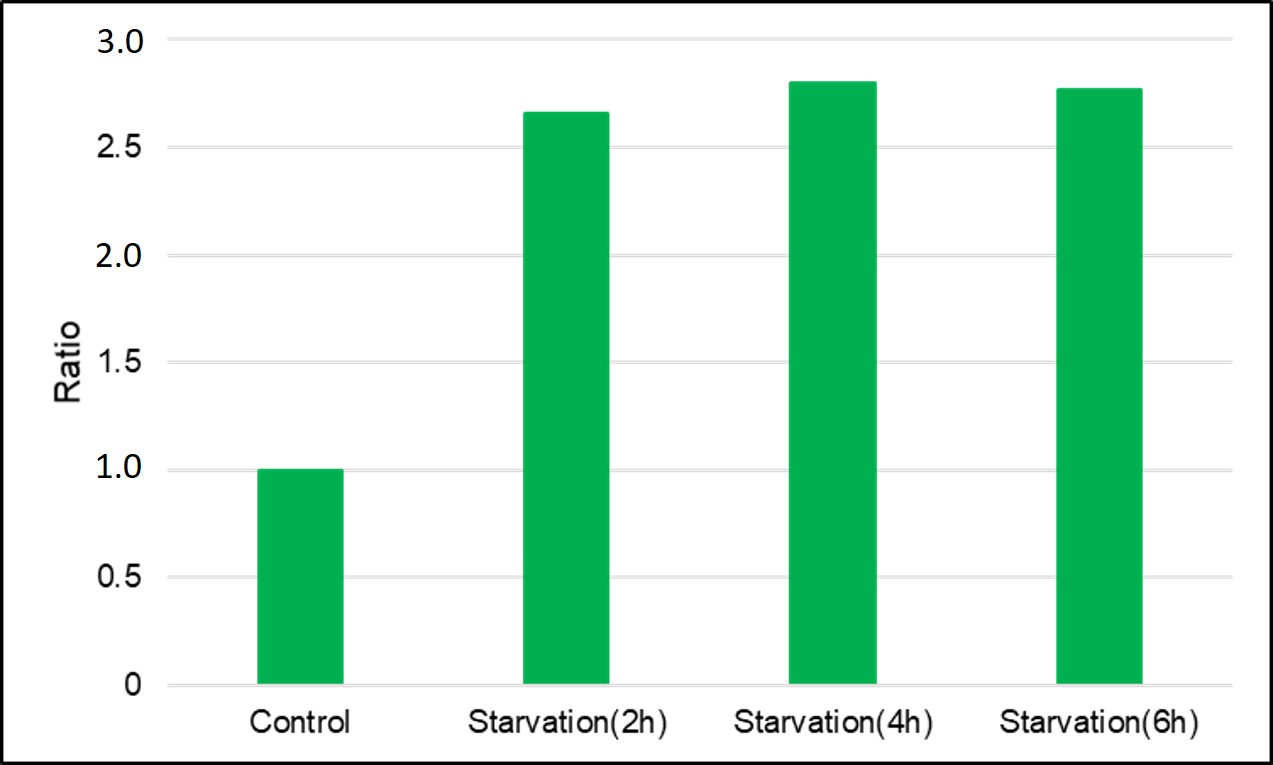
-
Q
How long can fluorescence be detected?
-
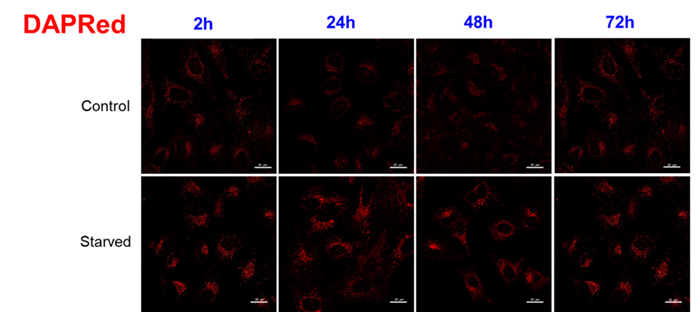
A
We have confirmed that the fluorescence brightness of DAPGreen decreases over a long period of time after staining, but we have a track record of confirming differences in fluorescence intensity with and without autophagy induction for up to 24 hours.
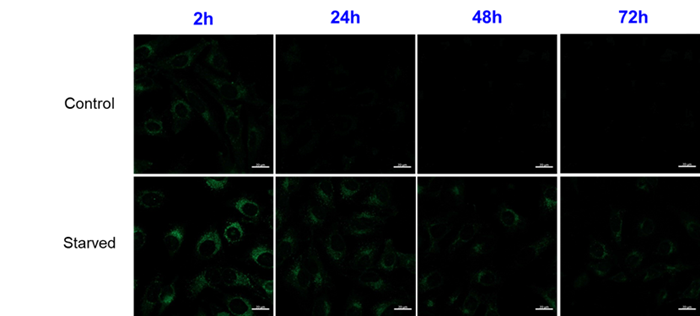
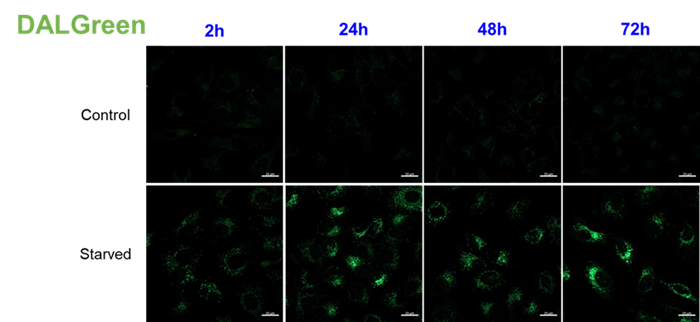
For use under conditions longer than 24 hours, we recommend using DAPRed, which detects the same autophagosomes as DAPGreen, or DALGreen, which detects autolysosomes. DAPRed and DALGreen can be monitored for up to 72 hours.
Handling and storage condition
| Purity (HPLC): | ≧ 90.0 % |
|---|
| -20°C, Protect from light, Nitrogen substitution |
Related products
The following related products are also used in research related to this product.