

Lysosome Function Analysis - Selection Guide for Detection and Imaging Reagent / Probe / Kit
Science Note
Lysosome Damage Responses in Disease Biology [Jun. 16, 2026]
Previous Science Note
|
Lysosomes regulate degradation, membrane integrity, and immune-related processing. Lysosome damage responses are important for understanding how organelle injury influences disease-relevant cellular outcomes. Recent studies identified Parkinson's disease-associated VPS13C as an early factor recruited to damaged lysosomes, suggesting a membrane-protective response before severe rupture. In macrophages lacking TMEM175, lysosomal stress during tumor debris processing promoted inflammatory cytokine release and responses that help present tumor antigens to CD8⁺ T cells. These findings support lysosome damage responses as a relevant focus in disease research. |
||||||||||||||||||||||
|
Summary: Highlighted technique: By combining pH-dependent and pH-independent lysosome probes, lysosomal pH and mass can be assessed by fluorescence imaging without immunostaining or transfection. |
||||||||||||||||||||||
|
Summary: Highlighted technique: Evaluating Ca²⁺ dynamics and intracellular ROS helps clarify lysosome-associated inflammasome activation. As a complementary approach, detecting intracellular and lysosomal lipid radicals may provide additional information on oxidative membrane stress associated with lysosomal dysfunction. |
||||||||||||||||||||||
|
|
||||||||||||||||||||||
All Related Techniques (click to open/close)
|
||||||||||||||||||||||
Application Note (click to open/close)
|
||||||||||||||||||||||
|
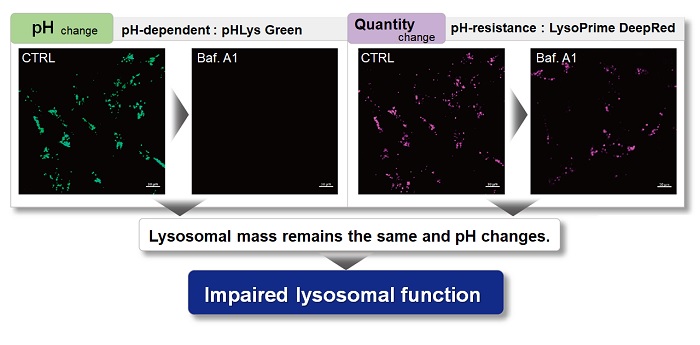
With existing reagents, it was difficult to determine whether lysosomal mass or their function (pH) fluctuated because the discussion was based on changes in the fluorescence brightness of a single dye. This kit contains pHLys Green, which is highly specific to lysosomes and shows pH-dependent changes in fluorescence, and pH-resistant LysoPrime Deep Red. Using these two dyes, lysosomal pH and volume of the same sample can be measured for a detailed analysis of lysosomal function.
|
|||
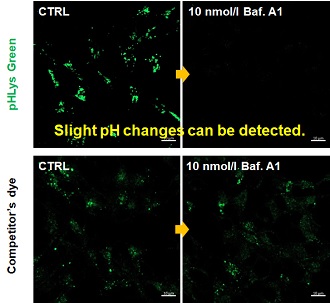
| Existing lysosomal pH detection reagents have issues with dye localization, pH sensitivity, and retention. pHLys Green is a dye that solves these issues. The improved dye retention and localization enable detection of normal lysosomes, and the improved pH sensitivity enables detection of slight pH changes. | |||
| 1. High sensitive pH detection Comparison of pH response of cells treated with low concentrations of lysosomal acidification inhibitor Bafilomycin A1 |
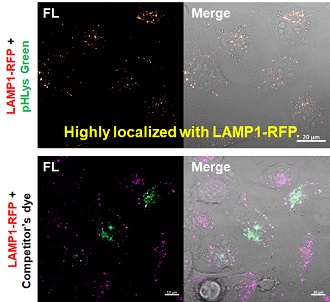
2. High specificity for lysosomes Comparison of specificity for lysosomes using lysosomal marker protein LAMP1-GFP expressing cells |
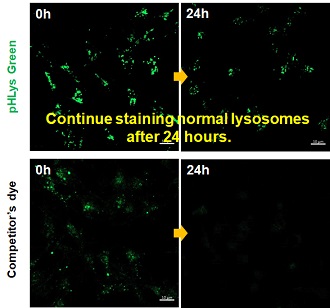
3. High retention in lysosomes Comparison of intracellular retention |
|
 |
 |
 |
|
|
Product in Use: Related Product: |
|||
Why is Lysosomal Function Important?
| Lysosome has been revealed to be an important organelle with a complex role in nutrient sensing and multifaceted signaling. Its importance has been emphasized in research fields as diverse as a neurological disease, cancer, immunity, and senescence. Recent research reveals that lysosome acidification declines in neurons well before extracellular amyloid deposition, thus lysosomal function is now a hot topic in Alzheimer's disease research. | Master the Basics with a Overview Map!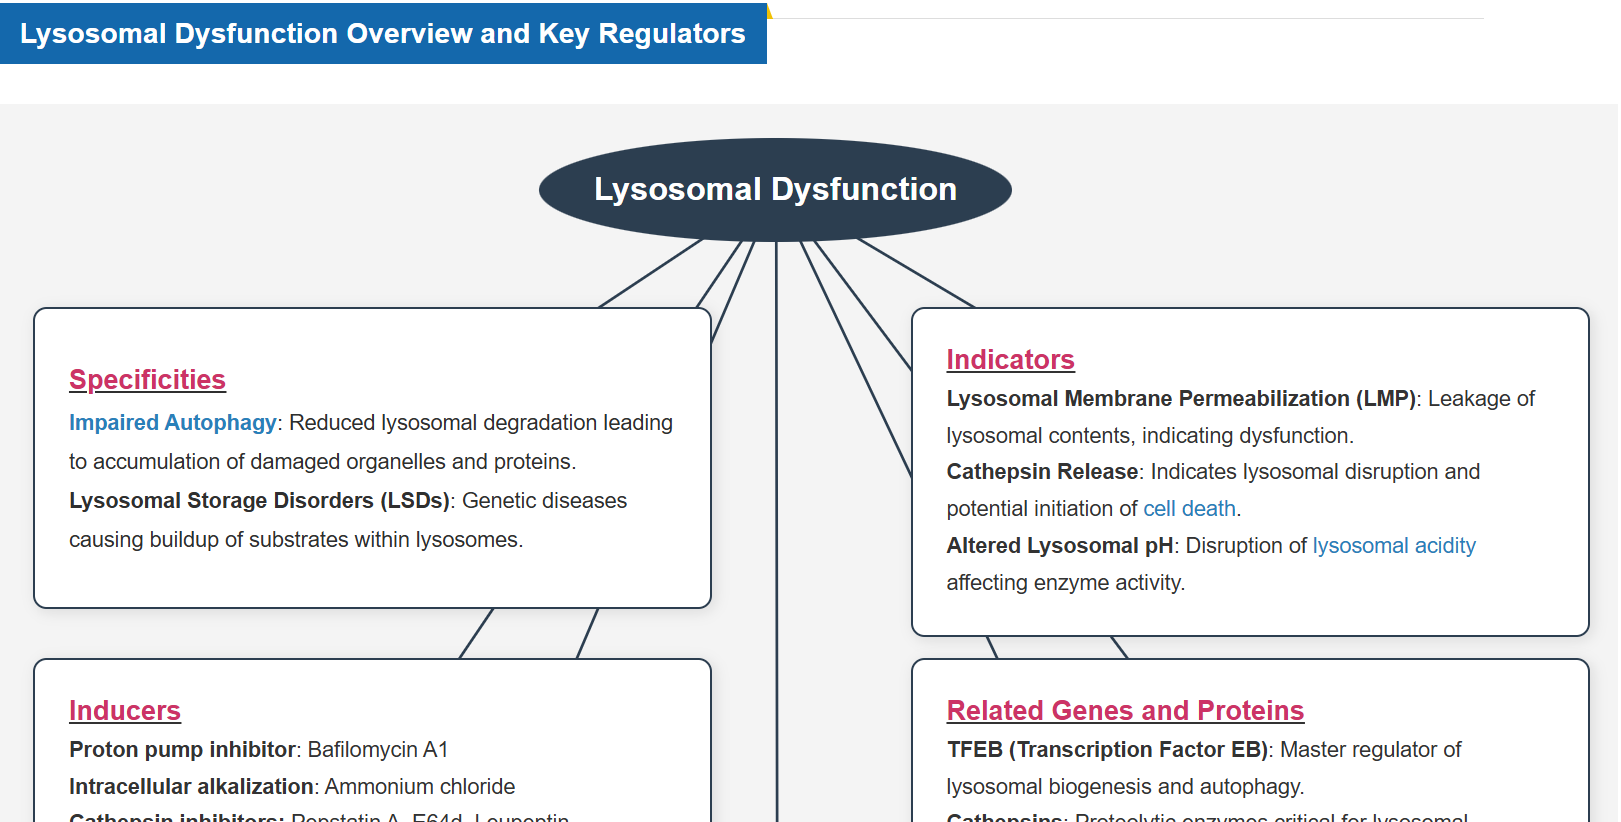 (Click to open) |
Topics
- What is Lysosome?
- How to Analyze Lysosomal Function?
- Lysosome Staining Reagents and Kits
- Experimental Example: Effect of lysosomal acidification inhibitor on endocytic vesicle fusion with lysosome
- Experimental Example: Effect of mitochondrial inhibitors on lysosomal function
- Experimental Example: Measurement of intracellular iron changes and lysosomal pH changes
What is Lysosome?
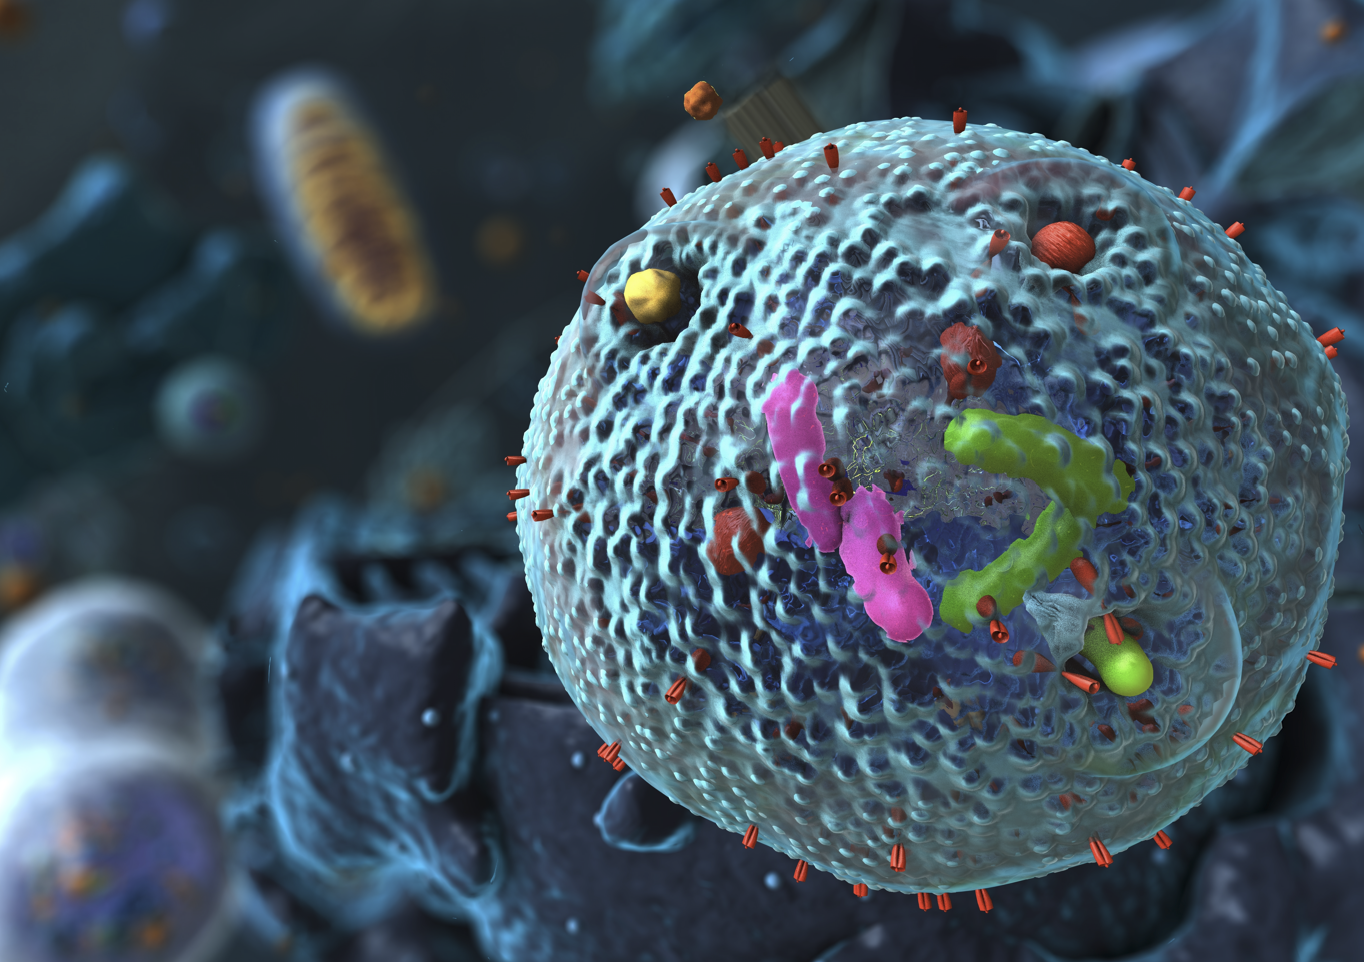 Lysosomes are essential for maintaining cell homeostasis by degrading and recycling biomolecules, regulating organelle quality control, and facilitating intracellular signaling. Lysosomal function is closely linked to the Golgi apparatus, endoplasmic reticulum, mitochondria, and nucleus, coordinating cellular metabolism and stress responses. When lysosomal function is impaired, damaged proteins and organelles accumulate, metabolic processes are disrupted, and cell membrane integrity is compromised, leading to various diseases. For example, in neurodegenerative diseases, lysosomal dysfunction leads to the accumulation of toxic aggregates, resulting in neuronal damage and cognitive decline. Understanding lysosomal regulation and its interactions with other organelles is critical for developing therapies to slow disease progression and promote cellular longevity.
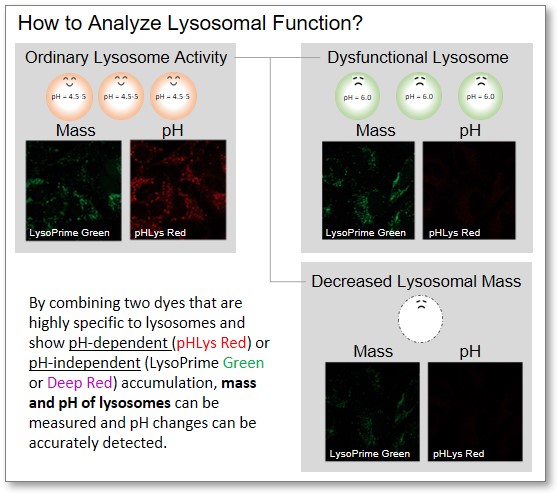
How to Analyze Lysosomal Function?
When conventional dyes are used to analyze lysosomal function, it is difficult to determine whether the lysosomal mass or their function (pH) has changed because the analysis is based only on the fluorescence intensity of a single dye.
Dojindo's kits contain two types of dyes: pHLys Red/Green, which shows a lysosomal pH-dependent change in fluorescence intensity, and LysoPrime Green/Deep Red, which is lysosomal pH-resistant. By combining these two dyes, the lysosomal function can be analyzed in detail by simultaneously analyzing lysosomal mass and pH.
Lysosome Staining Reagents and Kits
Explore Dojindo's wide range of lysosomal staining and pH detection dyes. Choose the following kit or reagent that aligns with your experimental requirements.
| Product Name (Item Code) |
Supported Devices | Indicator and Detection Color | Dyes and Fluorescence Properties |
Approximate Number of Use |
||
|---|---|---|---|---|---|---|
 |
 |
 |
||||
| Lysosomal Acidic pH Detection Kit-Green/Deep Red (L268) | ✓ | ✓ | ✓ | pH | pHLys Green Ex: 488 nm / Em: 490-550 nm |
[for 1 set] 35 mm dish: 10 dishes μ-Slide 8 well: 10 plates 96-well Plate: 2 plates |
| quantity | LysoPrime Deep Red Ex: 633 nm / Em: 640-700 nm |
|||||
| Lysosomal Acidic pH Detection Kit-Green/Red (L266) | ✓ | Need G/Y Laser G:532 nm Y:561 nm |
✓ | pH | pHLys Red Ex: 561 nm / Em: 560-650 nm |
|
| quantity | LysoPrime Green Ex: 488 nm / Em: 500-600 nm |
|||||
| pHLys Red- Lysosomal Acidic pH Detection (L265) | ✓ | ✓ | pH | pHLys Red Ex: 561 nm / Em: 560-650 nm |
[for 1 tube] 35 mm dish: 10 dishes μ-Slide 8 well: 10 plates 96-well Plate: 2 plates |
|
| LysoPrime Deep Red - High Specificity and pH Resistance (L264) | ✓ | ✓ | ✓ | quantity | LysoPrime Deep Red Ex: 633 nm / Em: 640-700 nm |
|
| LysoPrime Green- High Specificity and pH Resistance (L261) | ✓ | ✓ | ✓ | quantity | LysoPrime Green Ex: 488 nm / Em: 500-600 nm |
[for 10 μl] 35 mm dish: 10 dishes μ-Slide 8 well: 10 plates 96-well Plate: 2 plates |
Experimental Example: Effect of lysosomal acidification inhibitor on endocytic vesicle fusion with lysosome
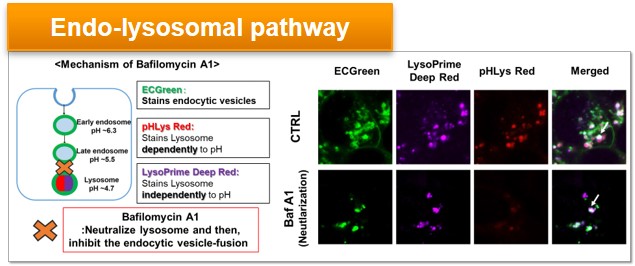
Endocytic vesicles were labeled by ECGreen and the lysosomal mass and pH were detected separately with LysoPrime Deep Red and pHLys Red. Co-staining with ECGreen and Lysosomal dyes showed the inhibition of endocytic vesicle-fusion induced by Bafilmycin A1.
Experimental Example: Effect of mitochondrial inhibitors on lysosomal function
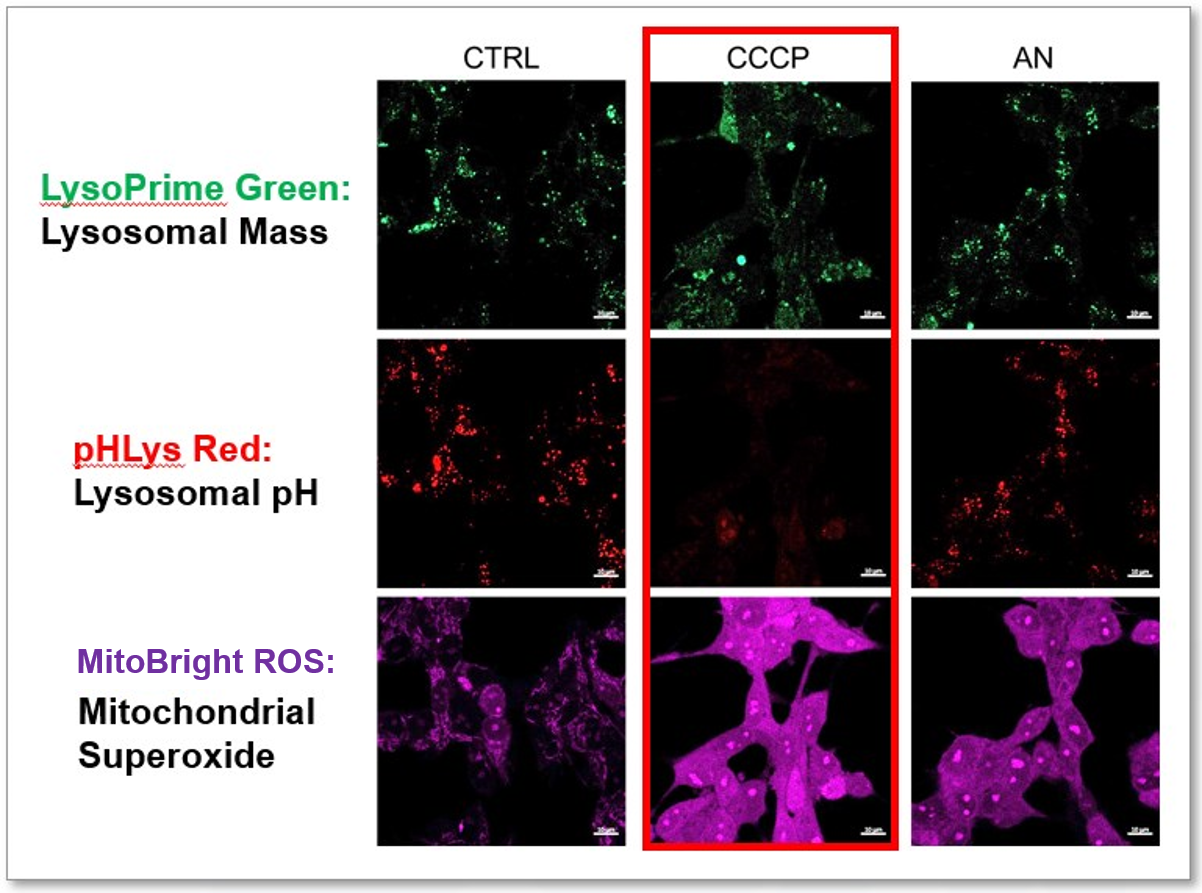
CCCP and Antimycin are recognized inducers of mitochondrial ROS, linked to the loss of mitochondrial membrane potential. Recent studies have shown that CCCP induces not only mitochondrial ROS but also lysosomal dysfunction. To observe mitochondrial ROS, HeLa cells were labeled with MitoBright ROS Deep Red for Mitochondrial Superoxide Detection, and the lysosomal mass and pH were independently detected with LysoPrime Green and pHLys Red. Co-staining with MitoBright ROS and Lysosomal dyes revealed that CCCP, unlike Antimycin, triggers concurrent lysosomal neutralization and mitochondrial ROS induction.
Reference: Benjamin S Padman, et. al., Autophagy (2013)
Products in Use
- LysoPrime Green
- pHLys Red
- Lysosomal Acidic pH Detection Kit
- MitoBright ROS Deep Red - Mitochondrial Superoxide Detection
Related Products
- Mitophagy Detection Kit and Mtphagy Dye
Experimental Example: Measurement of intracellular iron changes and lysosomal pH changes
In neurodegenerative diseases, the relationship between lysosomal function and iron has attracted attention, and it has been reported* that lysosomal neutralization prevents the breakdown of iron stores (Transferrin or Ferritin), resulting in a decrease in intracellular iron.
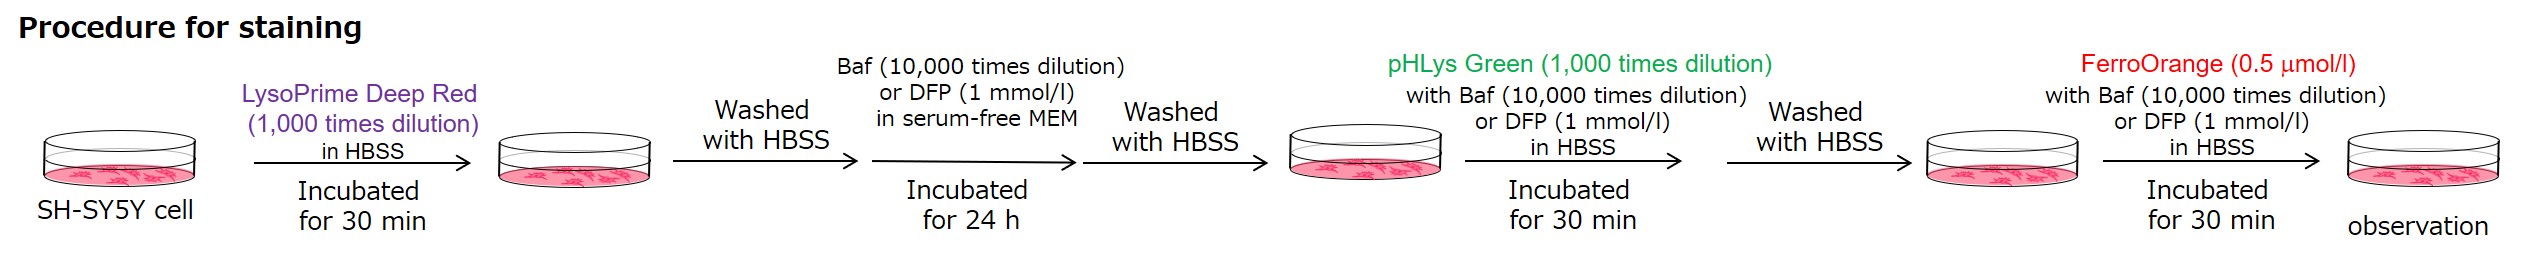
Lysosomal pH changes and intracellular iron changes in the same sample were detected using SH-SY5Y cells supplemented with lysosomal acidification inhibitor (Bafilomycin A1) or iron chelator (Deferipron (DFP)). (Lysosomal pH: Lysosomal Acidic pH Detection kit - Green/Deep Red, Intracellular iron: FerroOrange [Code:F374])
The results showed that the addition of Bafilomycin A1 decreased the fluorescence of FerroOrange, confirming the decrease in intracellular iron. The fluorescence of LysoPrime DeepRed remained almost unchanged, while the fluorescence of pHLys Green decreased due to lysosomal neutralization. These results suggest that there is a relationship between changes in intracellular iron and lysosome function.
*Mol Cell., 2020, 77(3), 645-655.
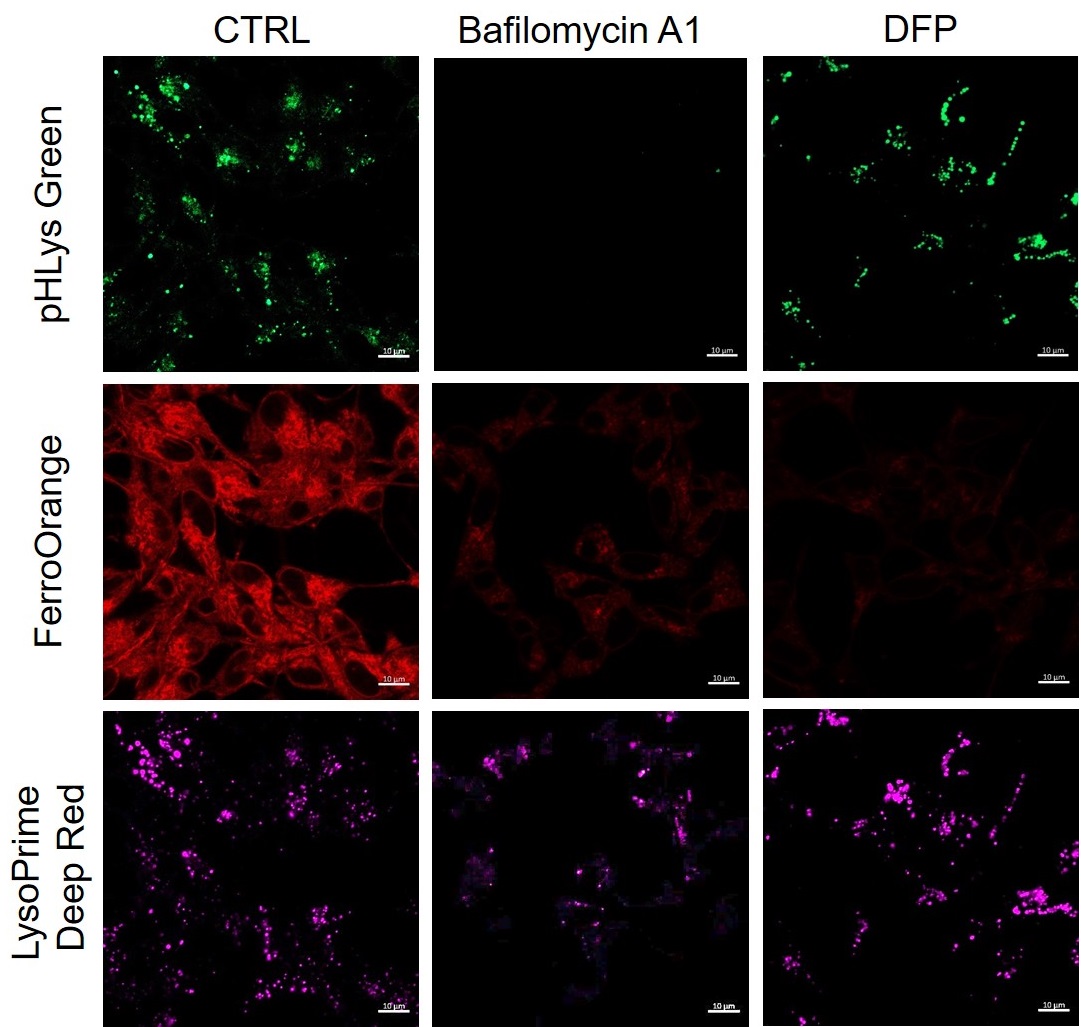
<Condition>
pHLys Green (Green) : Ex=488 nm, Em=486-574 nm
FerroOrange (Red) : Ex=561 nm, Em=550-650 nm
LysoPrime Deep Red (Violet) : Ex=633 nm, Em=599-700 nm


Related Technical Information


Product Classification
Product Classification
-
Cell Proliferation / Cell Cytotoxicity Assay
Cell Proliferation / Cell Cytotoxicity Assay Kits /Related Reagents
-
Cell Staining
Cell Double Staning Kit /Live Cell Staining /Dead Cell Staining /Nuclear Staining /Mitochondria Staning /Tissue Staining /Nucleolus Staining /Lipid Droplet Staining /Cell Membrane Staining /Lysosome Staining
-
Intracellular Fluorescent Probes
Reagents for Intracellular Calucuum Ion /Reagents for Intracellular Ion /Related Reagents
-
Labeling Chemistry
Protein Labeling Kits /Protein Labeling Reagents /HPLC Derivertization Reagents /Biotion Labeling Reagents /Related Reagents /Exsosome Labeling
-
Oxidative Stress
Stress Maker Detection /NO Detection /NO Donor /NO Inhibitor /ACE Inhibition Assay /Reagents・Kits for Sulfur Biology /Antioxidant Assay Kit /Donors for Sulfur Biology
-
-Bacstain- Series
Bacterial Proliferation Assay Kit /Bacteria Staining /Bacterial Fluorescent Staining
-
Molecular Biology
Transfection Reagents /Nuclear Staining /Agarose /Related Reagents /Buffer for Molecular Biology
-
Detergents
Detergents /Sets
-
Cross-Linking Reagents
Hetero-bifunctional Reagents /Homo-bifunctional Reagents /Others
-
Redox Dyes
Reductive Chromogenic Dyes /Electron Mediators /Oxidative Chromogenic Dyes /Trinder Reagents
-
Ion Analysis
Ionophores /Anion Eliminator /Solvent for Ion Electrode of Liquid Film Type
-
Organic Scintillator
-
Buffers
Buffers
-
Metal Chelates
EDTA /Other Chelator /Reagents for Chelator Titration
-
Chromogen/Metal Indicator
Chromogen/Metal Indicator
-
Water Analysis
/Fluorine /Iron / /Water Hardness /Residual Chlorine /ABS /Cyan / /Chromium /Copper
-
Extraction Reagent
AA Chelator /Related Reagents
-
High Purity Solvent
Spectrozole /Luminazole / /Acnazole /Dehydration Solvent for Synthesis
-
Biochemicals
Biochemicals
-
Functional Organic Material
Alkanethiol Derivative /Phosphonic Acid Derivatives
