 |
A mechanical checkpoint prevents transformation, while cell cycle duration influences cancer risk. Two recent studies reveal how cell cycle regulation influences whether cells become cancerous or remain benign. One study shows that mitotic errors can trigger senescence not through DNA damage but through changes in nuclear mechanics, including nuclear softening and chromatin disorganization¹. This process activates p53 through sensors such as mTORC2 and ATR, revealing a mechanical checkpoint that helps prevent transformation. Another study demonstrates that cells with shorter total cell cycle duration are more likely to transform, identifying cell cycle length as an early and reliable predictor of cancer risk². Together, these findings highlight the importance of both physical changes in the nucleus and the timing of cell division in suppressing tumor initiation. |
|||||||||||||||||
|
Chromosome mis-segregation triggers cell cycle arrest through a mechanosensitive nuclear envelope checkpoint (Nature Cell Biology., 2025) Highlighted technique: This study used a p21-GFP reporter system to monitor early senescence induction following chromosome mis-segregation. p21 is a key cell cycle inhibitor involved in senescence, and this system enabled real-time tracking of its expression dynamics at the single-cell level using live-cell imaging. Related technique Cellular Senescence Detection, Cell Cycle Assay |
||||||||||||||||||
|
Cell cycle duration determines oncogenic transformation capacity (Nature, 2025) Highlighted technique: In this study, senescence-associated β-galactosidase (SA-β-gal) staining was used to examine whether tumor-suppressive genetic alterations induce cellular senescence in the developing retina. The technique was applied across multiple genotypes at different developmental stages to evaluate senescence status in vivo. Related technique Cellular Senescence Detection, Cell Cycle Assay |
||||||||||||||||||
Related Techniques (click to open/close)
|
||||||||||||||||||
Application Note I (click to open/close)
|
||||||||||||||||||
|
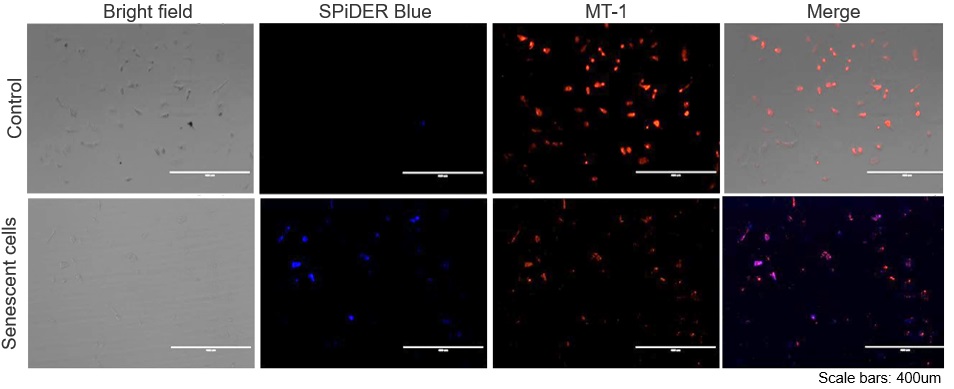
The senescent cell detection dye SPiDER Blue (SG07) and the mitochondrial membrane potential (MMP) dye MT-1 (MT13) were used to stain human microglial cells. Microscopy revealed that, compared to control cells, senescence-induced cells showed reduced MMP and increased SPiDER Blue fluorescence, reflecting elevated SA-β-Gal activity.
*This data was kindly provided by Dr. Supriya D. Mahajan, Department of Medicine, Jacobs School of Medicine & Biomedical Sciences. 1. Seed human microglia cells into a dish and incubate in an incubator set at 37 ℃ and equilibrated with 95% air and 5% CO2. |
Application Note II (click to open/close)
> Increased Senescence in Aged Adipose Tissue
|
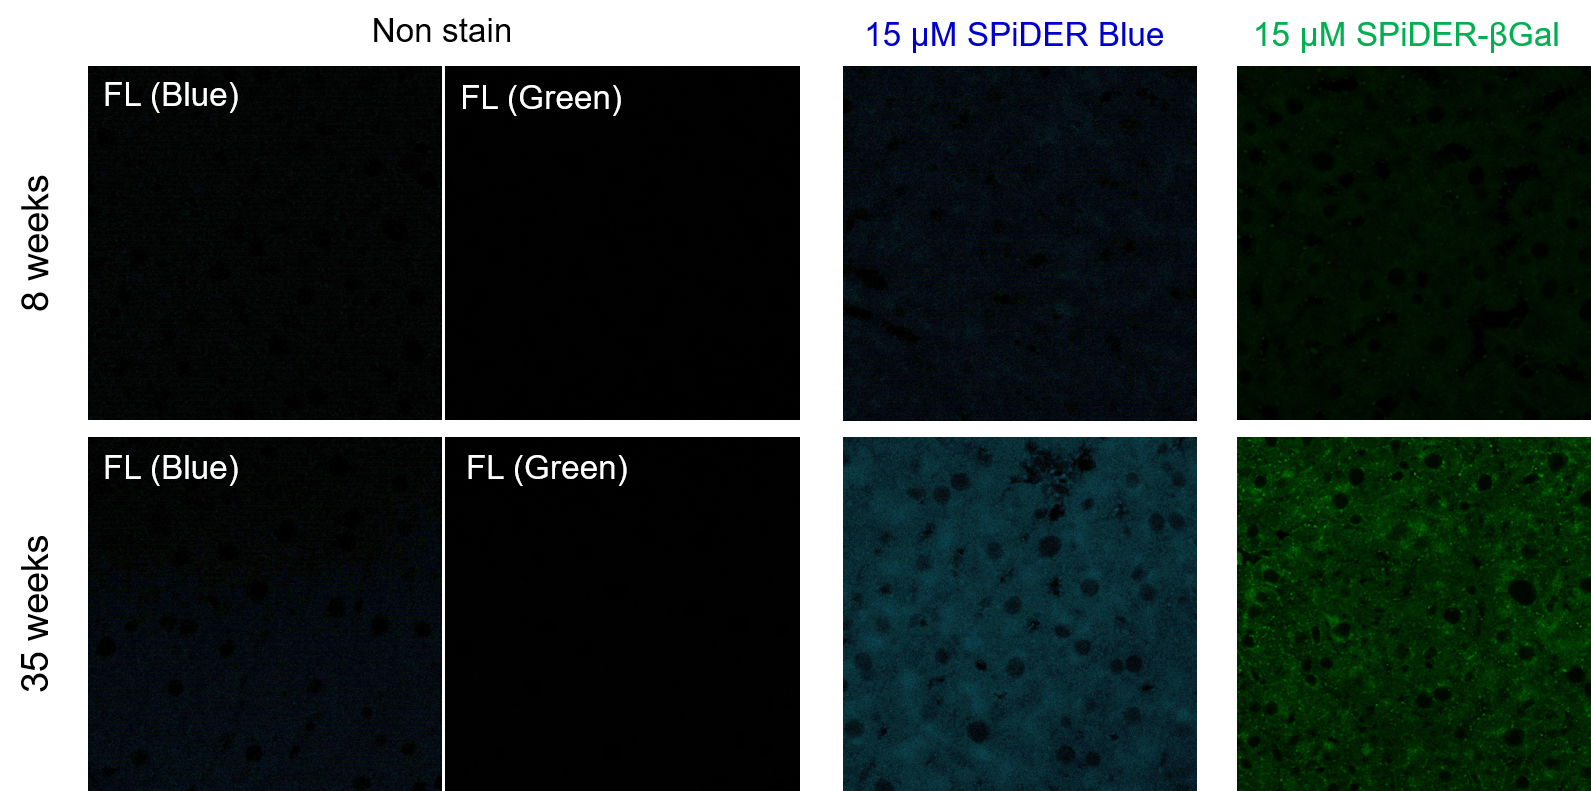
Frozen liver adipose tissue sections from 8-week-old and 35-week-old mice were stained with senescence detection probes SPiDER Blue (SG07) and SPiDER-βGal (SG02). Confocal microscopy revealed a marked increase in fluorescence intensity only in the 35-week-old samples, indicating an age-associated accumulation of senescent cells in older tissue.
1. 8-week-old and 35-week-old mouse liver adipose tissue (frozen sections) samples were prepared on glass slides. [Detection conditions] |