|
Glycolysis supports cancer cell proliferation by providing both metabolic intermediates and spatially localized energy. Defining how glycolytic regulation changes during tumor progression and drug resistance is important for identifying metabolic vulnerabilities in cancer. Recent studies showed that, in cancer cells, mitochondria-detached hexokinase supports the Warburg effect by promoting glucose uptake, lactate production, and glycolytic ATP supply for proliferation. Another study showed that HR+/HER2− breast cancer cells resistant to CDK4/6 inhibitors display enhanced glycolysis and mTORC1 signaling, while mTOR-driven autophagy suppression increases sensitivity to metabolic inhibitors such as metformin and DCA. Together, these findings highlight glycolytic control as a relevant factor in cancer cell survival and treatment response. |
||||||||||||||||||||
|
Hexokinase detachment from mitochondria drives the Warburg effect to support compartmentalized ATP production (Nature Metabolism, 2026) Highlighted technique: To examine hexokinase localization, the authors expressed an HA-tagged mitochondrial construct in K562 cells, immunopurified mitochondria, and assessed the enrichment of HK1 and HK2 in the mitochondrial fraction by immunoblotting. To analyze glycolysis, they collected conditioned medium at multiple time points along the growth curve to measure glucose uptake and lactate secretion, and further used 13C-glucose tracing to track the incorporation of glucose-derived carbon into downstream metabolites. |
||||||||||||||||||||
|
mTOR-driven autophagy suppression defines metabolic vulnerability in CDK4/6 inhibitor-resistant HR+/HER2− breast cancer (Cell Death & Disease, 2026) Highlighted technique: To investigate changes in autophagy in HR+/HER2− breast cancer cells, the authors generated cells stably expressing an LC3-HiBiT reporter, which enables luminescence-based tracking of the degradation dynamics of the autophagy marker LC3, and quantified changes in luminescence after treatment with the autophagy inhibitor chloroquine and the metabolic inhibitors metformin and DCA to assess autophagic flux. In addition, they performed cell viability and apoptosis assays under metabolically inhibitory conditions to evaluate vulnerability to metabolic inhibition. |
||||||||||||||||||||
Metabolism Activity and Autophagic Flux Indicators (click to open/close)
|
||||||||||||||||||||
Application Note (click to open/close)
|
||||||||||||||||||||
|
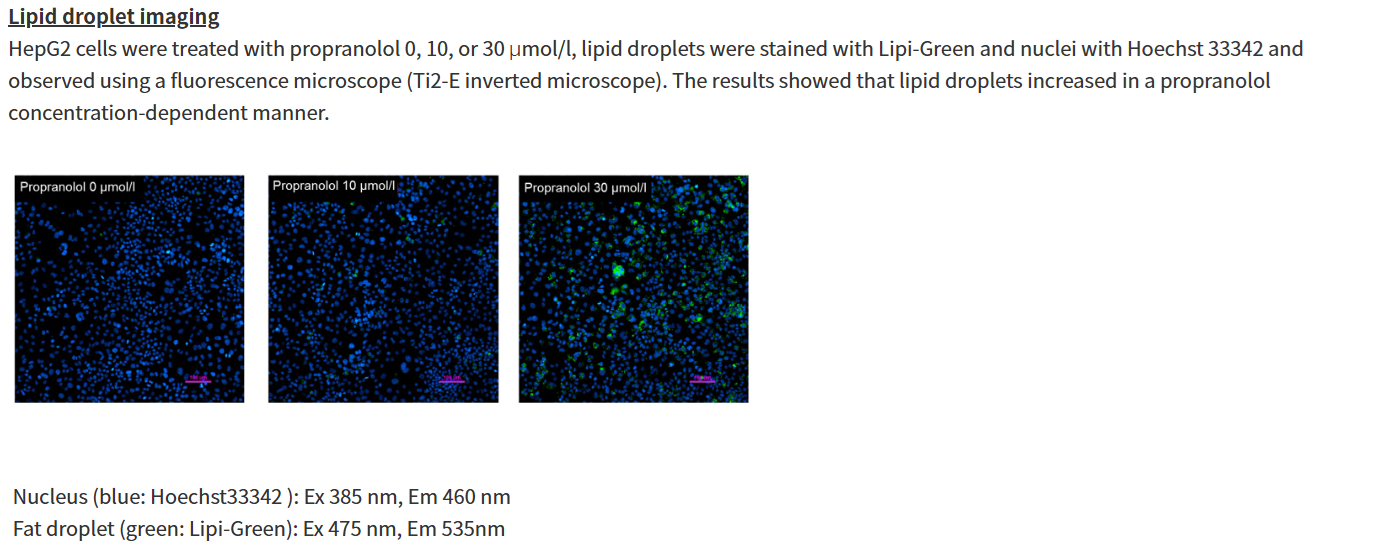
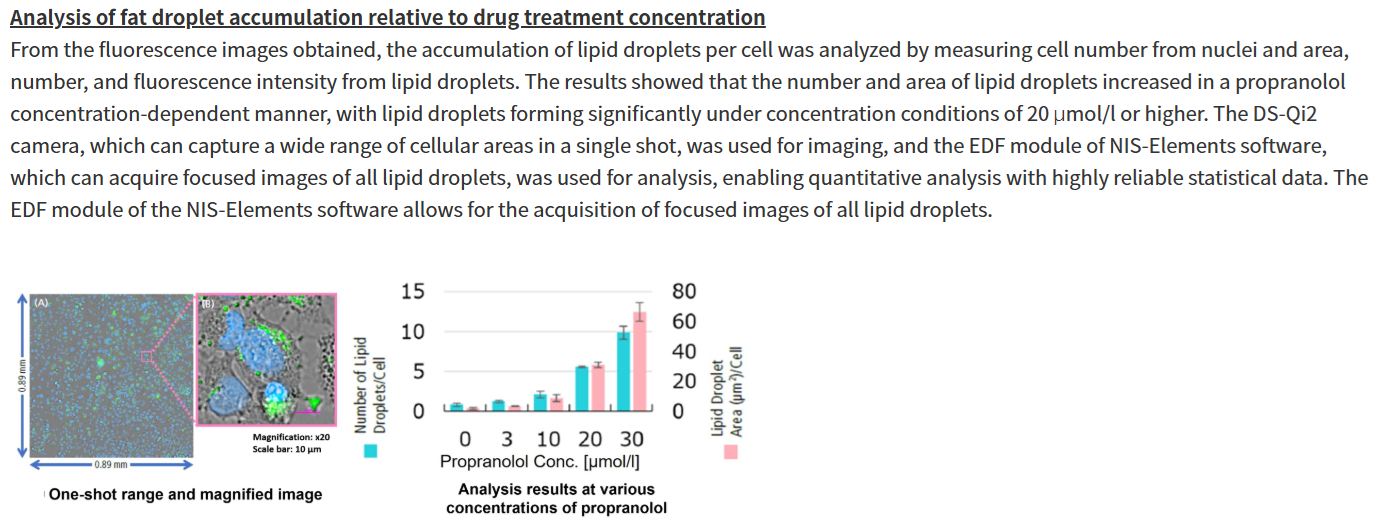
Propranolol (a sympathetic β-receptor blocker) was added to a human hepatocellular carcinoma cell line (HepG2 cells), and changes in lipid droplets were observed under a fluorescence microscope. The accumulation of lipid droplets was analyzed by measuring the number, area, and fluorescence intensity of lipid droplets from the acquired microscopic images.
For details of staining and analysis methods, please refer to "APPLICATION NOTE: Hepatotoxicity test of drug-induced lipidosis using high-content imaging" by Nikon Corporation. |