|
Cancer cells are known to avoid apoptosis, but the factors underlying differences in apoptotic responses between normal and cancer cells, as well as sensitivity to anticancer drugs were not fully understood. Recent studies have shown that the abundance, localization, and interactions of proteins involved in mitochondrial apoptosis influence cancer cell sensitivity and drug resistance.
The first paper showed that normal hepatocytes contain little VDAC2 protein, which positions BAK protein on the mitochondrial outer membrane, and consequently have low levels of mitochondrial BAK. Both proteins were elevated in many liver cancers, resulting in stronger mitochondrial responses and greater sensitivity to the tested apoptotic stimuli. The second paper identified a compound that interferes with the interactions of VDAC2 with BAX and BAK. The compound suppressed BAX, a protein that moves from the cytoplasm to mitochondria, while activating BAK, which already resides on mitochondria, to promote apoptosis. It also restored drug responses through the remaining BAK protein in leukemia cells that had acquired resistance following BAX loss.
Together, these studies show that responses to mitochondrial apoptosis depend not only on protein abundance, but also on protein localization, interactions, and regulatory state.
|
 |
VDAC2 and Bak scarcity in liver mitochondria enables targeting hepatocarcinoma while sparing hepatocytes
(Naghdi et al., Nature Communications, 2025)
Summary:
In this study, the authors examined why normal hepatocytes and hepatocarcinoma cells respond differently to apoptotic stimulation. Normal hepatocytes contained little VDAC2 protein, which positions BAK protein on the mitochondrial outer membrane, and consequently little mitochondrial BAK. Both proteins were increased in many liver cancers, making their mitochondria more responsive and the cancer cells more susceptible to the same apoptotic stimulus.
Highlighted technique:
Mitochondrial membrane potential was measured to compare early responses to apoptotic stimulation in normal hepatocytes and hepatocarcinoma cells. Dead-cell staining and intracellular ATP measurements were combined to determine whether these mitochondrial changes were accompanied by reduced cell viability.
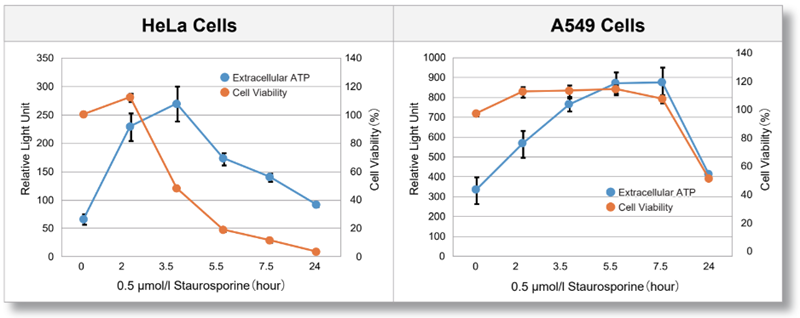
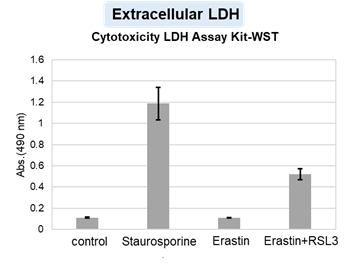
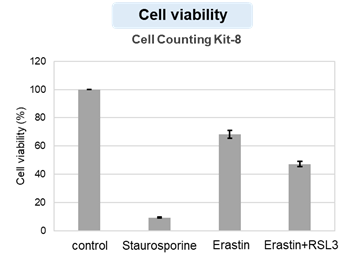
Combining high sensitive mitochondrial membrane potential measurements in live cells after drug stimulation with intracellular ATP, Annexin V, and LDH assay can distinguish early mitochondrial changes from subsequent reductions in viability, early apoptotic membrane changes, and plasma membrane damage.
Differential regulation of BAX and BAK apoptotic activity revealed by small molecules
(Li et al., Science Advances, 2025)
Summary:
In this study, the authors identified a compound that disrupts VDAC2 interactions with two apoptosis promoting proteins but affects them in opposite directions. It blocked BAX recruitment from the cytoplasm to mitochondria while releasing BAK, which already resides on mitochondria, from VDAC2 mediated inhibition. Activating the remaining BAK restored drug responses in BAX deficient leukemia cells, revealing a potential strategy to overcome resistance caused by BAX loss.
Highlighted technique:
To compare responses mediated by the two apoptotic proteins, mitochondrial membrane potential was measured using a fluorescent probe and flow cytometry. Intracellular ATP measurements and dead cell staining were used to evaluate early mitochondrial responses and subsequent changes in cell viability after compound treatment.
Cellular reducing activity can screen compound effects on cell viability, while mitochondrial membrane potential indicates whether viability changes coincide with altered mitochondrial responses. Annexin V binding and extracellular LDH activity can further distinguish early apoptotic membrane changes from loss of plasma membrane integrity.
Cell Death-Related Indicators (click to open/close)
|