|
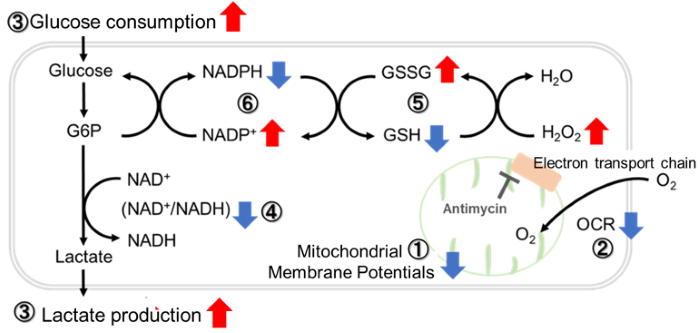
Recent studies suggest that understanding mitochondrial ROS signaling requires evaluating not only ROS levels, but also the site and mechanism of ROS production, mitochondrial membrane potential, glycolytic and oxidative metabolism, and downstream cellular responses. In macrophages exposed to a bacterial component, elevated membrane potential and succinate oxidation supported reverse electron transport at Complex I, defining the metabolic conditions that generate superoxide capable of regulating inflammatory cytokine release. In lipid-loaded macrophages, mitochondrial superoxide activated a gene regulatory pathway that contributed to impaired respiration and reinforced further ROS production and lipid accumulation.
|
 |
Pro-inflammatory macrophages produce mitochondria-derived superoxide by reverse electron transport at complex I that regulates IL-1β release during NLRP3 inflammasome activation
(Casey et al., Nature Metabolism, 2025)
Summary:
In this study, the authors show how inflammatory macrophages generate signaling superoxide after exposure to a bacterial component. Reduced ATP synthase dependence elevated mitochondrial membrane potential, while succinate oxidation maintained reduced CoQ, enabling reverse electron transport at Complex I. The resulting superoxide regulated release of an inflammatory cytokine, linking a defined respiratory mechanism of ROS production to control of the macrophage inflammatory response.
Highlighted technique:
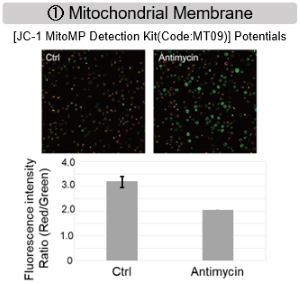
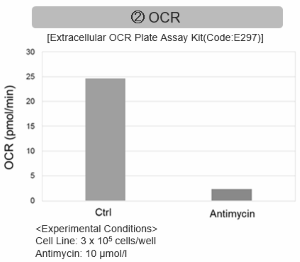
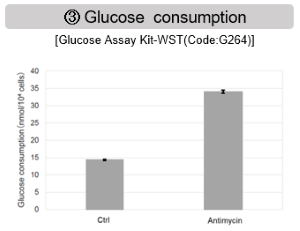
To identify the metabolic conditions supporting mitochondrial superoxide production, the study combined confocal imaging of superoxide and membrane potential with Seahorse measurements of OCR and ECAR and quantification of ATP to ADP ratios, lactate, succinate, and CoQ redox state.
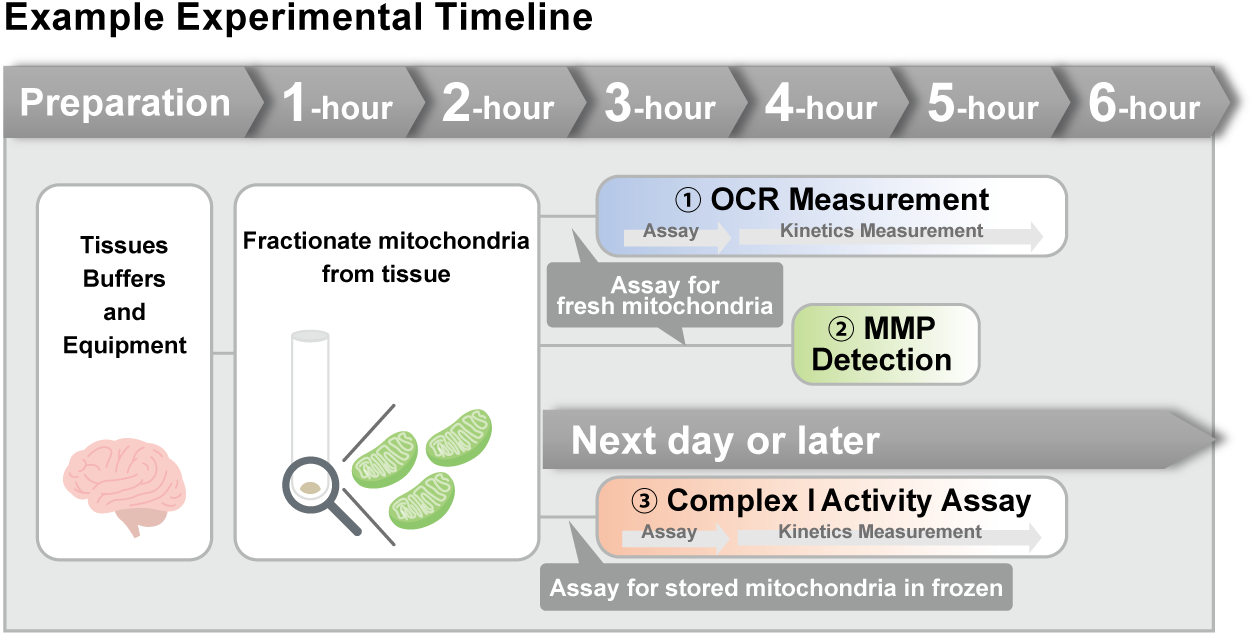
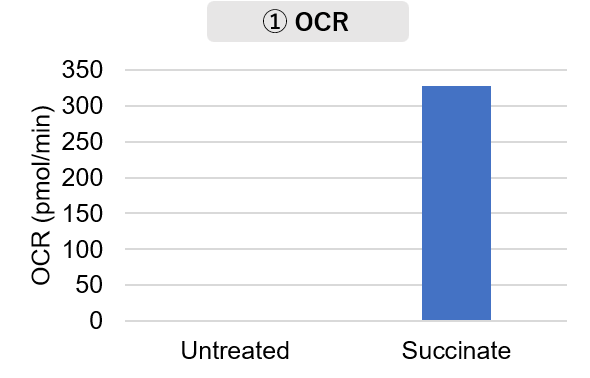
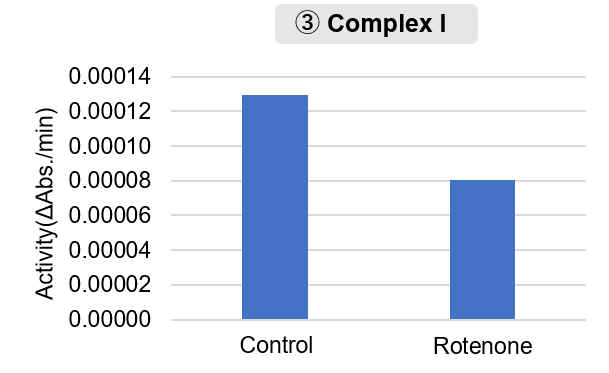
As a complementary approach, intact mitochondria isolated from tissues can be analyzed for OCR and Complex I activity to assess the electron transport chain conditions underlying mitochondrial ROS generation.
Mitochondrial ROS drive foam cell formation via STAT5 signaling in atherosclerosis
(Boccuni et al., Science Advances, 2025)
Summary:
In this study, the authors show that uptake of oxidatively modified LDL, a lipid particle that accumulates in atherosclerosis, does more than increase mitochondrial oxidative stress. In human and mouse macrophages, mitochondrial superoxide activates STAT5, a signaling protein that regulates gene expression and metabolism. STAT5 increased CD36 expression and contributed to impaired pyruvate dehydrogenase activity and respiration, creating a self reinforcing loop that promoted lipid uptake and foam cell formation.
Highlighted technique:
To examine how mitochondrial ROS promotes lipid accumulation and associated metabolic remodeling, the study measured mitochondrial superoxide, membrane potential, and neutral lipids during ROS scavenging and inhibition of STAT5, a regulator of gene expression and metabolism, and quantified OCR and ECAR to assess changes in glycolysis and OXPHOS.
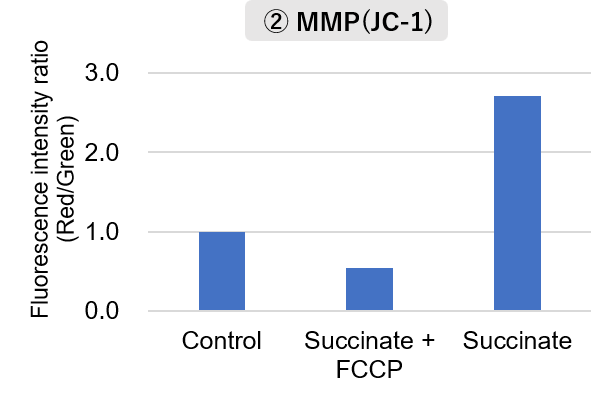
Evaluating mitochondrial ROS and membrane potential together with OCR, glycolysis/OXPHOS balance, and lipid droplet accumulation may help capture how metabolic changes develop into a lipid accumulating cellular state.
Mitochondrial Related Activity Indicators (click to open/close)
|