Neurodegeneration Research and Mitochondria

Neurodegeneration-Autophagy and Mitochondrial Damage

Indicator Mitophagy Mitochondrial fission abnormalities ROS MPTP (Mitochondrial Permeability Transition Pore) MMP (Mitochondrial Membrane Potential) ATP
Detection Kit MD01 Mitophagy Detection Kit MT10/MT11/MT12 MitoBright LT Green/Red/Deep Red R252/R253
ROS Assay Kit
- MT09:JC-1 MT13:MT-1 A550 ATP Assay Kit-Luminescence
Alzheimer's disease (AD)
Parkinson's disease (PD) - -
Huntington's disease (HD) - - -
Amyotrophic lateral sclerosis (ALS) -

Refernce :

Role of Mitochondria in NeurodegenerativeDiseases: From an Epigenetic Perspective
 

Mitophagy / Autophagy Analysis Products

Product Name Probe 1
Dyes and Fluorescence Properties
Probe 2
Dyes and Fluorescence Properties
Mitophagy Detection Kit Mtphagy Dye
Ex: 500-560 nm, Em: 670-730 nm
Lyso Dye
Ex: 350-450 nm, Em: 500-560 nm
Mtphagy Dye Mtphagy Dye
Ex: 500-560 nm / Em: 690-750 nm
 
Autophagic Flux Assay Kit* DAPRed
Ex: 500-560 nm / Em: 690-750 nm
DALGreen
Ex: 350-450 nm / Em: 500-560 nm

   *Autophagic Flux Assay Kit includes lysosome acidification Inhibitor as a negative control.


Neurodegeneration Disease & Cell Death Mode

Neuron Disease Cell Death Mode Triggers Effectors Hallmarks

ALS、PD:neuronal apoptosis plays a key role in both diseases, involving mechanisms such as the p53 gene, lnc RNA, FUS gene mutations, and mitochondrial dysfunction

Apoptosis

DNA damage
Growth factor ↓

DAMPs Receptor ligation(TNFR,TRAIL,FAS)

Caspase-3/7

1. Cleaved caspase-3
2. Nuclear condensation
3. Membrane blebbing

AD: lipid peroxidation is linked to synaptic loss;

PD: iron accumulation and mutations related to iron metabolism are associated with neurodegeneration.

Ferroptosis GPX4 ↓
SLC7A11
ACSL4 ↓
Lipid peroxides 1. Shrunken mitochondria

PD is marked by reduced copper content and dysfunction of copper transporter (CTR-1).While copper's role in PD is clear, the impact of cuproptosis on disease progression needs further research.

Cuproptosis Copper accumulate FDX1 ↑ SLC31A1 ↑ Proteotoxic stress 1. Aggregation of DLAT
2. Fe-S cluster ↓

AD:Necroptosis via RIPK1/RIPK3/MLKL causes inflammation and neuronal death. Increased RIPK3/MLKL in AD correlates with reduced neuronal density.

HD: Mutant huntingtin induces necroptosis through the Hippo pathway, where targeting it prevents motor decline and reduces RIP3 levels.

Necroptosis TNF
TLR
ZBP1
IFN
RIPK1
RIPK3
MLKL
1. Caspase-independent cell death
2. Inflammatory response through membrane rupture
(DAMPs such as extracellular ATP are released)

Reference:

Neuronal regulated cell death in aging-related neurodegenerative diseases: key pathways and therapeutic potentials

Neurodegeneration & LLPS


What is Liquid-Liquid Phase Separation (LLPS)?

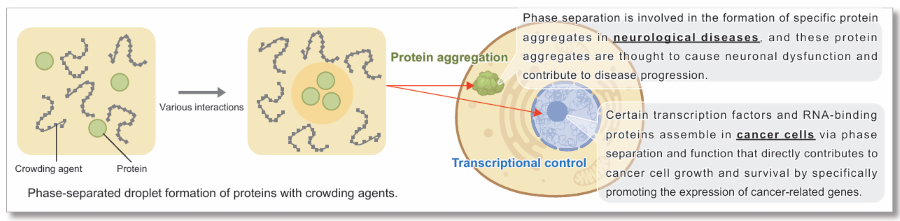
Liquid-liquid phase separation (LLPS) is a phenomenon in which certain molecules assemble locally within a cell to form aggregates (droplets) of biomolecules with liquid-like properties. In recent years, LLPS has attracted much attention as it has been shown to affect many biological processes in the cell. Although the study of droplets formed by phase separation is still in its infancy, elucidating how these biological phenomena affect cellular functions and the pathogenesis of disease is considered key to the development of new therapeutic strategies.

Reference: Dolgin, E. Nature, 2018, DOI: 10.1038/d41586-018-03070-2.
 

Protein aggregation is a hallmark of neurodegenerative disease. Many proteins found in pathological inclusions are known to undergo LLPS, a reversible process of molecular self-assembly. Recent evidence suggests that dysregulated LLPS may act as a precursor to protein aggregation in neurodegeneration. Ongoing research aims to elucidate the underlying mechanisms and explore strategies for modulation.

Reference: Zbinden, A. Developmental Cell, 2020, DOI: 10.1016/j.devcel.2020.09.014.


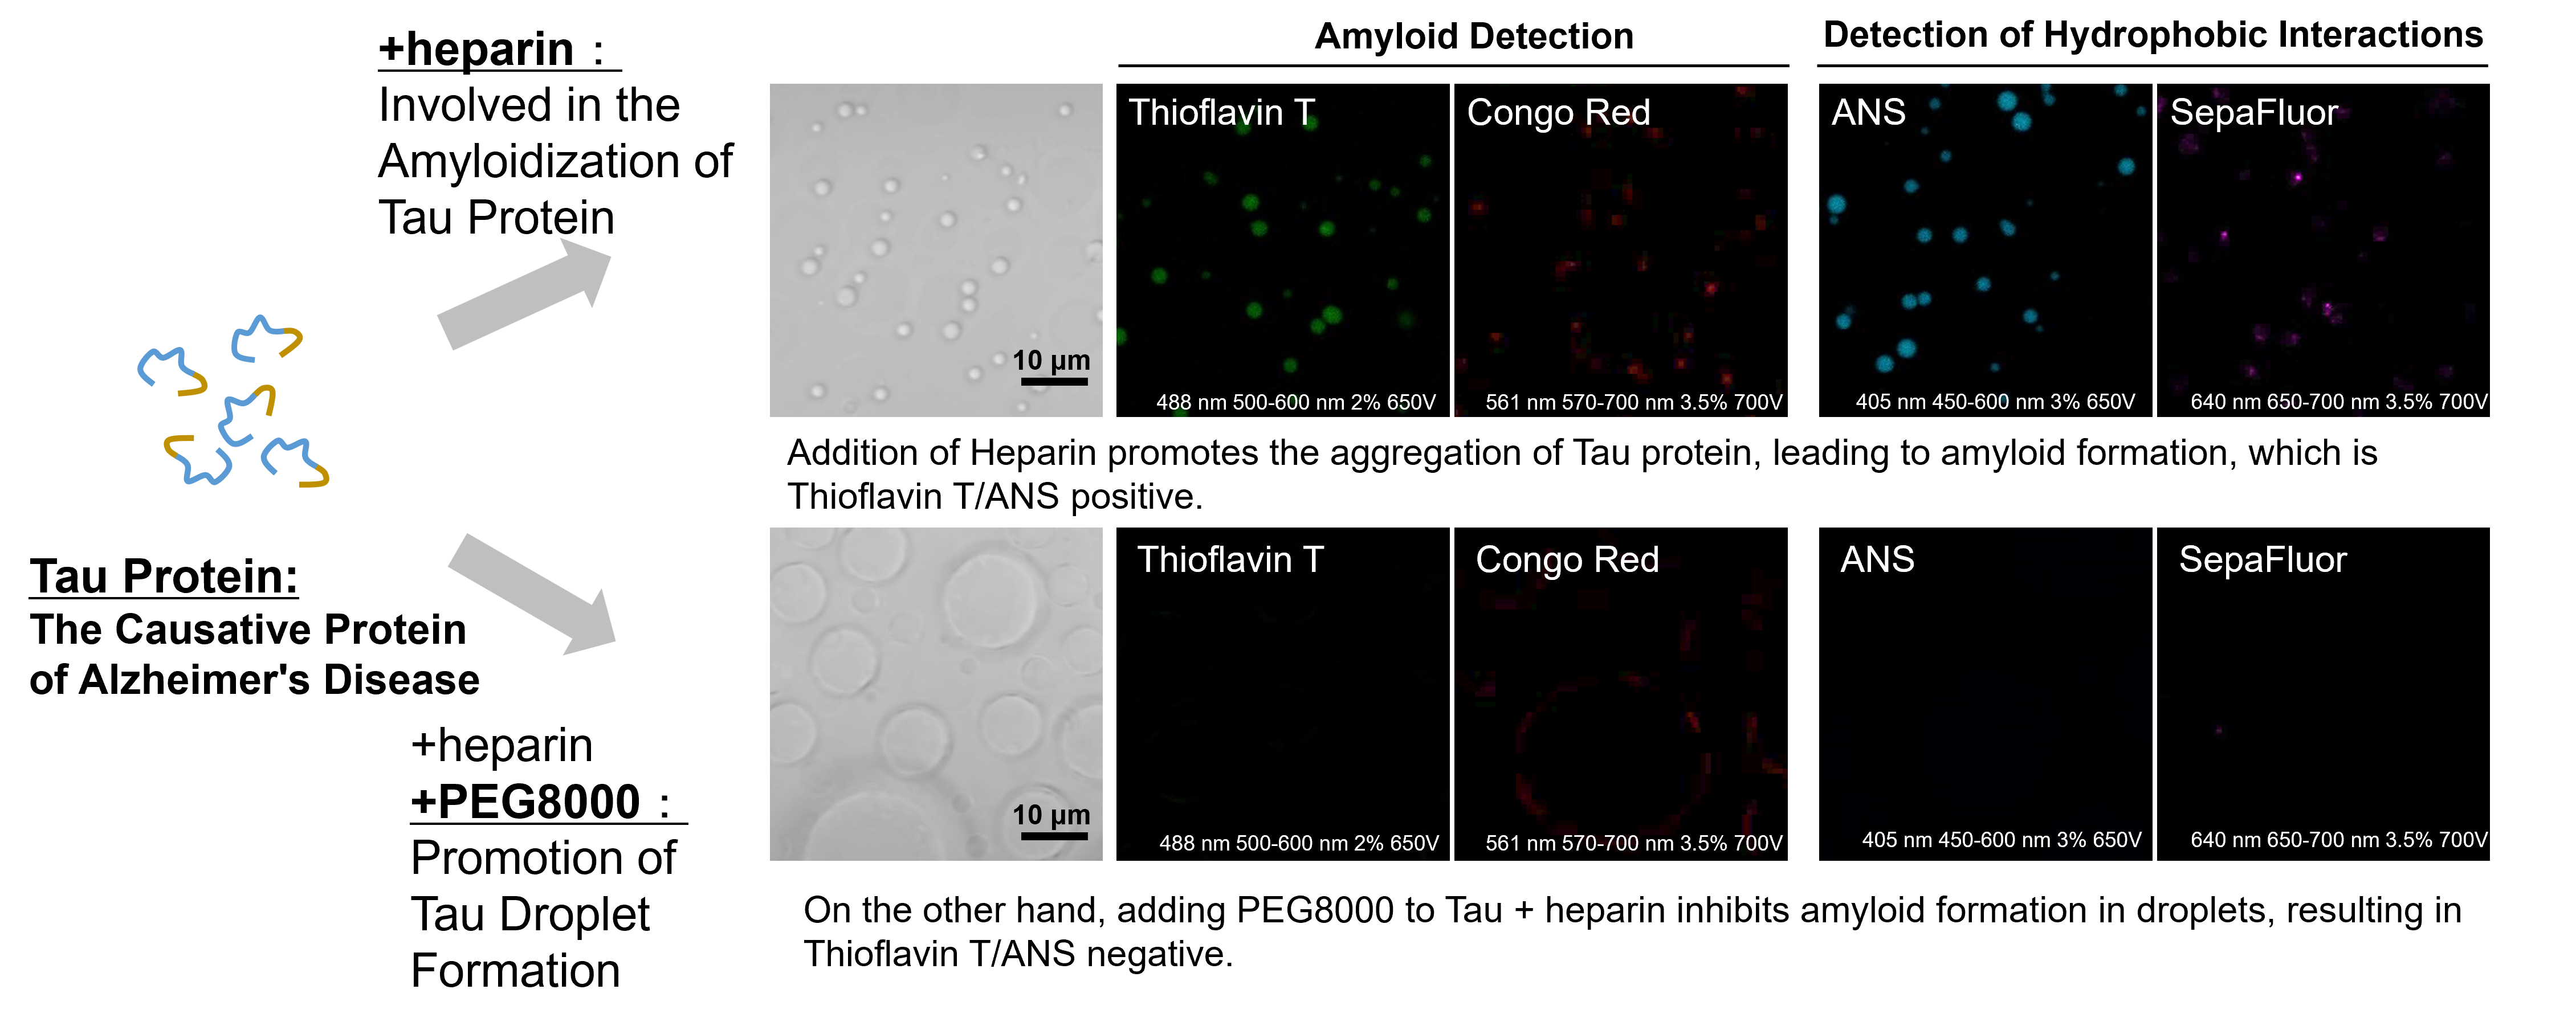
Experimental example: effect of crowding agents on the properties of Tau protein droplets.

LLPS Characterization-dye Set was used to investigate the properties of tau protein droplets: when heparin, a scaffold, was added to the tau protein, tau protein droplets were observed and were positive with both amyloid staining dyes, Thioflavin T and Congo Red.
The droplets were also positive with both ANS and SepaFluo dyes, which fluoresce in a hydrophobic environment, suggesting an amyloid-like aggregation structure.
On the other hand, under the condition of adding the crowding agent PEG8000, the tau protein droplets were enlarged and the fluorescence signals of all dyes were weakened.
These results suggest that the enhancement of phase-separated droplet formation by the crowding agent may affect the properties of the tau protein droplets.

<Experimental conditons>
Tau 441(WT):10 μmol/l    
Heparin:20%    
PEG8000:10 %      
Buffer: 10 mmol/l HEPES (pH 7.4), 150 mmol/l NaCl
Dye:10 μmol/l Thioflavin T, Congo Red, ANS, 100 nmol/l SepaFluor      
Incubate (37℃):7 days
Fluorescence microscope :Zeiss LSM800

Experimental Example: Changes in various indicators of cell death induced by drugs

HepG2 cells treated with the apoptosis-inducing agent staurosporine or the ferroptosis-inducing agents Erastin and RSL3. After treatment, extracellular LDH, phosphatidylserine, cell viability, intracellular Fe2+ and lipid peroxidation were determined.

The results showed that apoptosis-induced cells treated with staurosporine showed an increase in phosphatidylserine, a decrease in cell viability and an increase in extracellular LDH, indicating that cell death had occurred. On the other hand, intracellular Fe2+, an indicator of ferroptosis, remained unchanged. In cells treated with Erastin, a ferroptosis inducer, intracellular Fe2+ increased and cell viability decreased, but extracellular LDH and lipid peroxidation (lipid peroxidation: decrease in red fluorescence and increase in green fluorescence) did not increase. In cells in which ferroptosis was more strongly induced by co-treatment with RSL3 in addition to Erastin, increased intracellular Fe2+ and lipid peroxidation were observed. Moreover, decreased cell viability and increased dead cells were detected. Meanwhile, phosphatidylserine showed a lower rate of increase during ferroptosis induction compared to apoptosis-induced cells. These results suggest that cell death can be distinguished by evaluating a combination of cell death indicators.

[Products in use]
Extracellular LDH  : Cytotoxicity LDH Assay Kit-WST (Product code: CK12)
Phosphatidylserine: Annexin V Apoptosis Plate Assay Kit(Product code: AD12)
Cell viability          : Cell Counting Kit-8 (Product code: CK04)
Intracellular Fe2+  : FerroOrange (Product cose: F374) *Normalized with Hoechst 33342 fluorescence intensity
Lipid peroxidation  : Lipid Peroxidation Probe -BDP 581/591 C11- (Product code: L267)

[Experimental conditions]
Cell type: HepG2 cell(2×10⁴ cells/well)
Drugs: Staurosporin(5 μmol/l), Erastin(25 µmol/l), Erastin+RSL3(both 25 µmol/l) *Diluted in serum-free medium

Experimental Example: Mitophagy Induction and Mitochondrial Membrane Potential Changes

Mitochondrial condition in the carbonyl cyanide m-chlorophenyl hydrazine (CCCP) treated Parkin-expressing HeLa cells was compared with untreated cells using Mitophagy Detection Kit (MD01, MT02) and JC-1 MitoMP Detection Kit (MT09).

Result: Mitophagy was hardly detected in the CCCP-untreated cells, and mitochondrial membrane potential was maintained normally. On the other hand, in CCCP-treated cells, we observed a decrease in mitochondrial membrane potential (decrease in red fluorescence of JC-1) and induction of mitophagy (increase in fluorescence of Mtphagy Dye).

Transfection of Parkin plasmid to HeLa cells
 - HileyMax (H357) was used to transfect Parkin plasmid to HeLa cells (Parkin plasmid/HilyMax reagent: 0.1μg/0.2 μL) by incubating overnight.

Detection of Mitophagy
 1. Add 0.1 μmol/L Mtphagy working solution to Parkin expressing HeLa cells and incubated for 30 minutes at 37 ℃
 2. Wash cells with HBSS
 3. Add 10 μg/mL CCCP/MEM solution and inclubate for 2 hours at 37 ℃
 4. Observe under fluorescence microscope

Detection of Mitochondrial Membrane Potential
 1. Add 10 μg/mL CCCP/MEM solution to Parkin expressing HeLa cells and incubate for 1.5 hours at 37 ℃
 2. Add 4 μmol/L JC-1 working solution (final concentration: 2 μmol/L) and incubate for 30 minutes at 37 ℃
 3. Wash with HBSS and add Imaging Buffer Solution.
 4. Observe under fluorescence microscope

Mitophagy Detection
  Ex: 561 nm, Em: 570-700 nm

Mitochondrial Membrane Potential Detection
  Green Ex: 488 nm, Em: 500-550 nm
  Red Ex: 561 nm, Em: 560-610 nm


Product Classification

Product Classification