


G-Quadruplex Staining Kit

Intracellular Guanine Quadruplex (G4) Detection Kit
- Stains for dsDNA and G4DNA/RNA.
- Compatible with both live and fixed cells
- Live cell staining assay buffer included.
-
Product codeLL04 G-Quadruplex Staining Kit
| Unit size | Price | Item Code |
|---|---|---|
| 200 tests | $450.00 | LL04-10 |
| 200 tests | G-Quadruplex Dye Assay Buffer (9x) |
400 μl × 1 10 ml × 1 |
|---|
General Information
The G-quadruplex (G4) is a higher-order structure formed by guanine-rich nucleic acid sequences, where two or more stacked planes of G-quartets—each consisting of four guanine bases—form a stable structure. G4s play a role in maintaining genome stability and regulating gene expression, drawing significant scientific interest. It is estimated that approximately 3,800 G4 structures exist in human cellular mRNAs. Existing fluorescent probes require fluorescence lifetime imaging to distinguish G4 structures from other nucleic acid sequences, posing equipment-related limitations1)2). Currently, fluorescent immunostaining with antibodies is the standard method for G4 detection. However, this technique requires cell fixation, making live-cell imaging challenging and highlighting the need for a more convenient detection method.
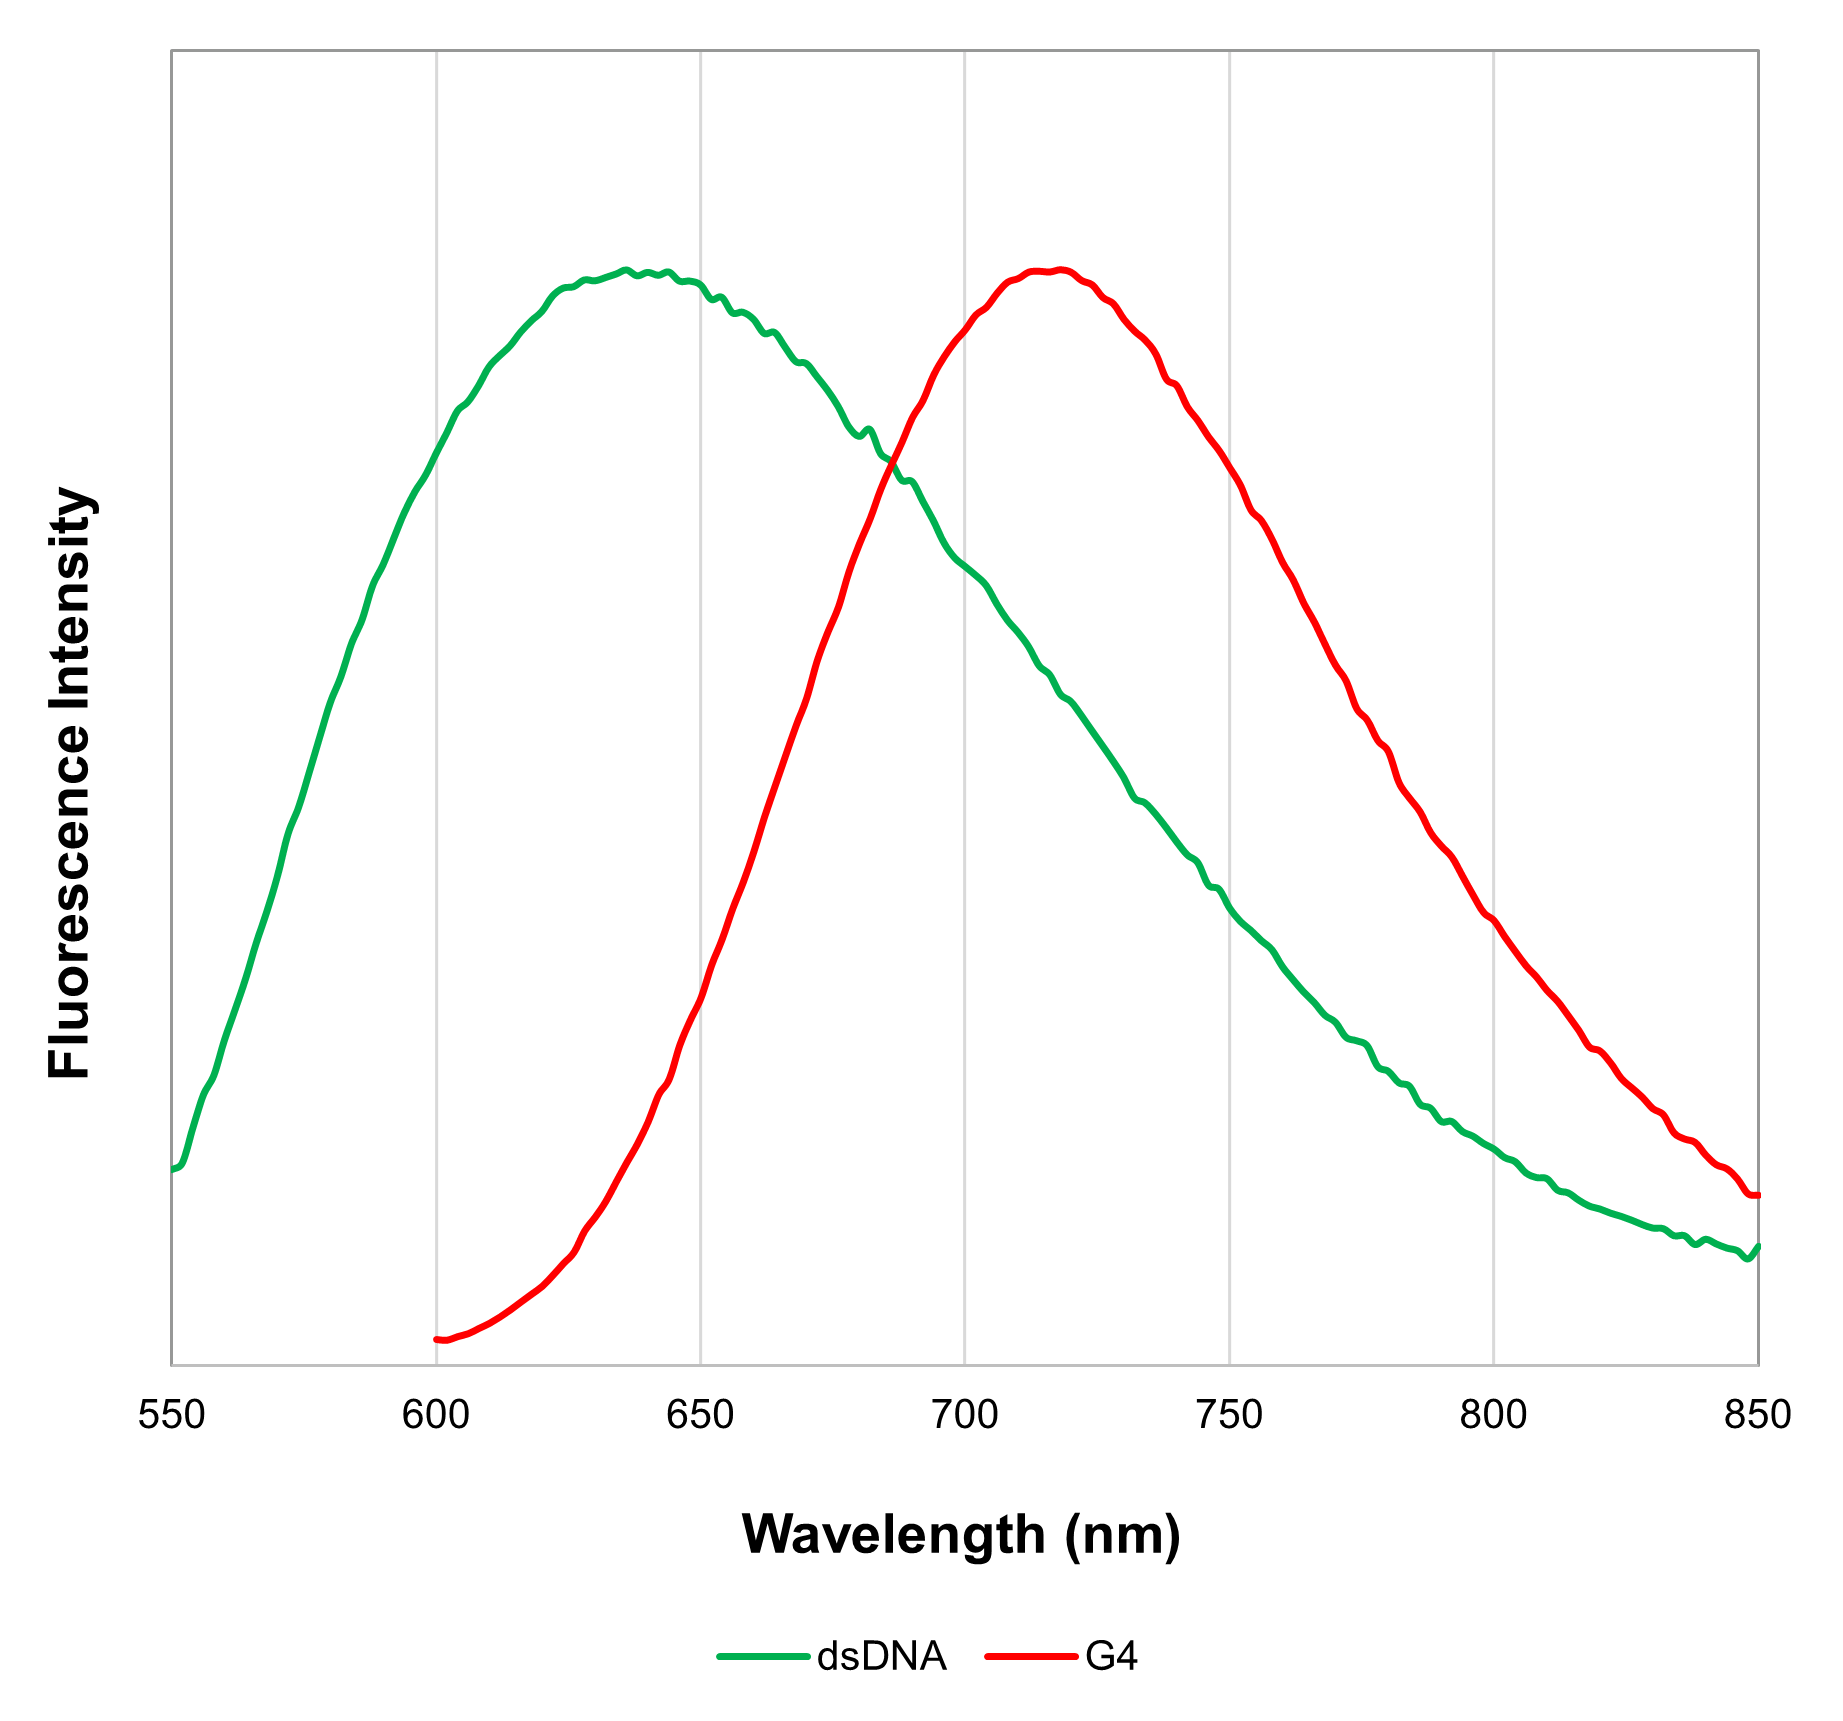
The G-Quadruplex Dye included in this kit is a two-color fluorescence switch-on probe. It intercalates into double-stranded DNA (dsDNA), emitting fluorescence at 600 nm (excitation wavelength 470 nm). Additionally, it binds to G4 DNA/RNA and fluoresces at 700 nm (excitation wavelength 570 nm)3). This dye thus enables the detection of both dsDNA and G4 DNA/RNA. Furthermore, the Assay Buffer included in this kit allows imaging in both fixed and live cells.
1. Liu-Yi Liu. et al., Angew. Chem., Int. Ed. 2020, 59(24), 9719–9726.
2. Summers, P. A. et al., Nat. Commun. 2021, 12, 162.
3. Takashi Sakamoto. et al., Analytical Chemistry, 2022, 94(10), 4269–4276.
Manual
Technical info
| Excitation | Emission | |
| dsDNA | Ex : 450–490 nm | Em : 570–640 nm |
| G4 DNA / RNA | Ex : 540–580 nm | Em : 670–730 nm |
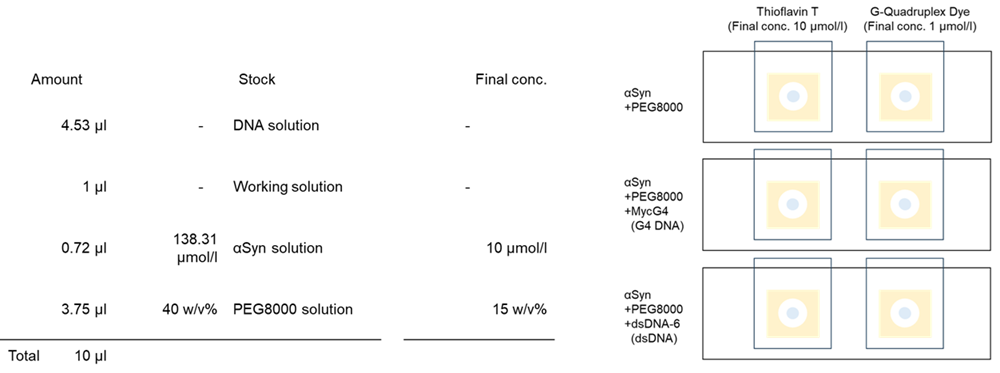
Experimental Example: Staining of G4 DNA and α-synuclein (αSyn) protein aggregates
The formation of protein–DNA aggregates was assessed using α-synuclein (αSyn) protein combined with either MycG4 (G4 DNA) or dsDNA-6 (dsDNA). Samples were stained with G-Quadruplex Dye and thioflavin T.
Preparation of a working solution
One (1) µl of G-Quadruplex Dye was diluted with 9 µl of PBS, and 1 µl of 10 mmol/l Thioflavin T DMSO solution was diluted with 99 µl of PBS.
*Thioflavin T was used in the (LL03) LLPS Characterization-dye Set.
Preparation of PEG8000 solution
A 40 % (w/v) PEG8000 solution were prepared with PBS.
*PEG8000 was used in the (LL02) LLPS Forming Condition Screening Kit.
Preparation of DNA solution
Two 0.5-ml microtubes were prepared, and 44.3 µl of PBS was added to each tube; 1.0 µl of each 100 µmol/l DNA solution was added and mixed.
Preparation, staining, and observation of αSyn aggregates
- Four point five three (4.53) µl of DNA solution was added to each 0.5 ml microtube.
- One (1) µl of G-Quadruplex Dye and Thioflavin T working solution was added.
- Zero point seven two (0.72) µl of αSyn solution(SPR-321, StressMarq Biosciences)was added to each 0.5 ml microtube.
- Three point seven five (3.75) µl of 40 % PEG8000 solution was added to each 0.5 ml microtube ; 20 pipetting cycles were performed for each 0.5 ml microtube.
*Because of its high viscosity, the PEG8000 solution should be added slowly using reverse pipetting.
*Manual pipetting is strongly recommended to avoid the foaming that tends to occur when using electric pipettes.
*After adding the PEG8000 solution, promptly pipette to prevent protein aggregation if left standing for an extended period.
5. Two (2) µl of sample solution was added to a glass slide with double-sided tape with a hole. The glass slides were covered with a cover glass and incubated at 37°C for 18 days, protected from light. After incubation, the samples were observed under a fluorescence microscope.
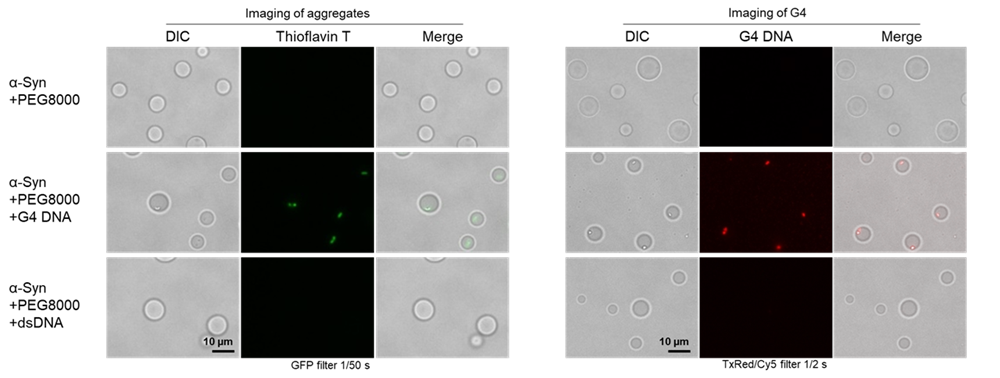 |
| Fig4. Fluorescence imaging of aggregates and G4 of each oligo DNA and αSyn protein |
Bright-field microscopy and thioflavin T staining revealed that aggregates formed only in the condition where MycG4 (G4 DNA) was present (middle row). Additionally, staining with G-Quadruplex Dye confirmed the accumulation of G4 DNA within the aggregates.
Experimental Example: Fluorescence imaging of dsDNA and G4 in living and fixed cells
- Assay for living cells -
- HeLa cells (2.0 x 10⁴ cells/well, MEM containing 10% fetal bovine serum and 1% penicillin-streptomycin) were seeded on a μ-slide 8 well plate (ibidi) and cultured at 37°C overnight in a 5% CO2 incubator.
- After the culture medium was removed, the cells were washed once with 200 μl of assay buffer (1x).
- After the supernatant was removed, a working solution (200 μl) was added to the cells.
- The cells were incubated at 37°C in a 5% CO2 incubator for 10 min.
- After the supernatant was removed, the cells were washed with 200 μl of Opti-MEM twice.
- Opti-MEM (200 μl) was added, and the cells were observed by fluorescence microscopy.
- Assay for fixed cells -
- HeLa cells (2.0 x 10⁴ cells/well, MEM containing 10% fetal bovine serum and 1% penicillin-streptomycin) were seeded on a μ-slide 8 well plate (ibidi) and cultured at 37°C overnight in a 5% CO2 incubator.
- After the culture medium was removed, the cells were washed with 200 μl of PBS once.
- One hundred (100) μl of 4% paraformaldehyde (PFA) / PBS solution was added to the cells and incubated at room temperature for 10 minutes.
- The 4% PFA / PBS solution was removed, and the cells were washed with 200 μl of PBS Two times.
- The cells were washed once with 200 μl of assay buffer (1x).
- Two hundred (200) μl Working solution was added to the cells and incubated at 37°C for 10 minutes.
- The cells were observed by fluorescence microscopy.
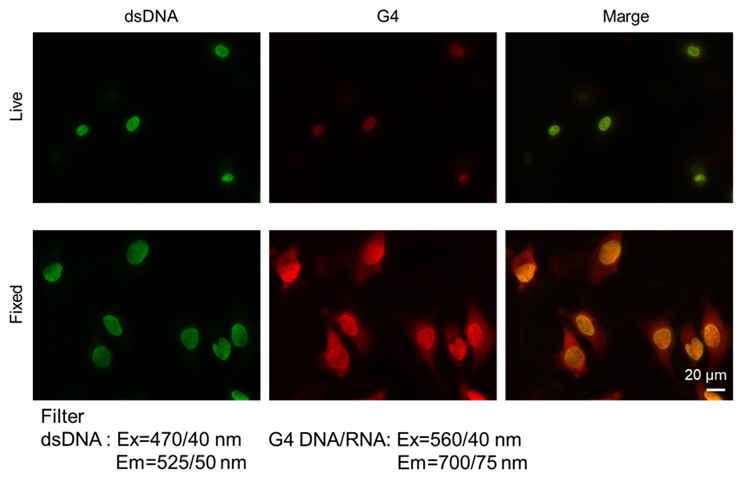 Figure 1. Fluorescence signals from HeLa cells detected with a microscope |
Experimental Example: Detection of dsDNA and G4 in DNA oligonucleotide using G-Quadruplex Dye
Preparation of G-Quadruplex Dye solution
G-Quadruplex Dye (30 μl) was diluted by adding 20 μl of DMSO.
Preparation of 100 μmol/l DNA solution
dsDNA-6, dsDNA-4, c-Myc, and MycG4 (all from Macrogen) were dissolved in 50 mmol/l Tris–HCl buffer containing 100 mmol/l KCl to prepare a 100 µmol/l DNA solution.
Table 4. Oligonucleotides sequences
|
Name |
Amount |
Structure |
Sequence 5’ to 3’ |
| dsDNA-6 | 64 nmol | dsDNA | GCGCAAATTTGCGC |
| dsDNA-4 | 64 nmol | dsDNA | CTTTTGCAAAAG |
| c-Myc | 58 nmol | G4 DNA | TGGGGAGGGTGGGGAGGGTGGGGAAGG |
| MycG4 | 60 nmol | G4 DNA | TGAGGGTGGGTAGGGTGGGTAA |
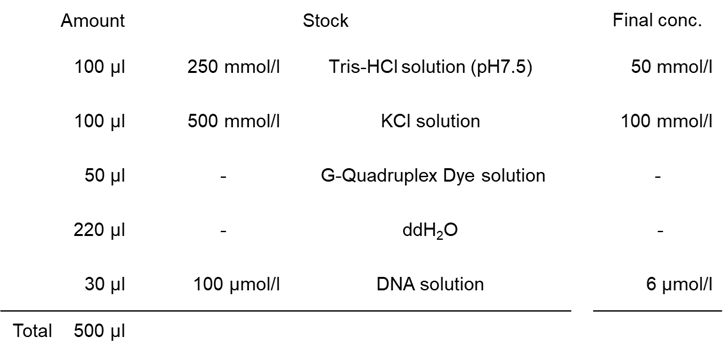
Staining and measurement of DNA
- One hundred (100) µl of 250 mmol/l Tris-HCl solution was added to each 1.5 ml microtube.
- One hundred (100) µl of 500 mmol/l KCl solution was added to each tube.
- Fifty (50) µl of G-Quadruplex Dye solution was added to each tube.
- Two hundred and twenty (220) µl of ddH2O was added to each tube.
- Thirty (30) µl of 100 μmol/l DNA solution was added to each tube.
- 150 µl of sample solution was added to each well of a 96-well black clear-bottom microplate (IWAKI, 5882-096), and the fluorescent signal was measured using a plate reader.
 |
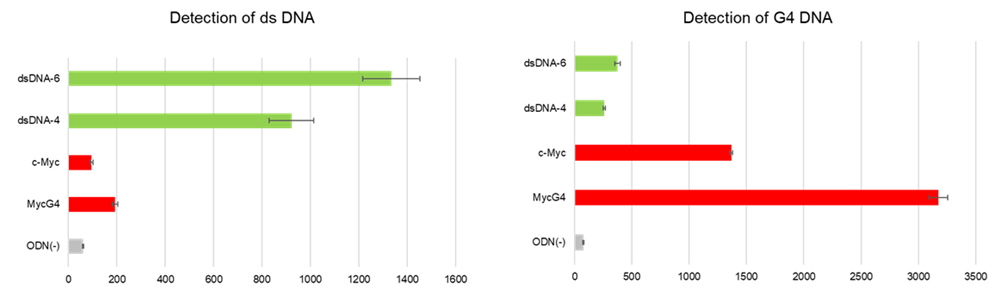 |
| Figure 2. Detection of dsDNA and G4 in each DNA oligonucleotide |
Each DNA oligonucleotide sample was stained with G-Quadruplex Dye. The results showed that when excited at 470 nm, dsDNA-6 and dsDNA-4, which have a dsDNA structure, exhibited high fluorescence intensity. When excited at 570 nm, c-Myc and MycG4, which contain abundant G4 DNA structures, exhibited high fluorescence intensity.
Experimental Example: Fluorescence imaging of the intracellular G4 in A549 cells treated with Pyridostatin (PDS)
- A549 cells (2.0 x 10⁴ cells/well, MEM containing 10% fetal bovine serum and 1% penicillin-streptomycin) were seeded on a μ-slide 8 well plate (ibidi) and cultured at 37°C overnight in a 5% CO2 incubator.
- After the culture medium was removed, the cells were washed once with 200 μl of assay buffer (1x).
- After the supernatant was removed, a working solution (200 μl) was added to the cells.
- The cells were incubated at 37°C in a 5% CO2 incubator for 10 min.
- After the supernatant was removed, the cells were washed with 200 μl of Opti-MEM twice.
- Twenty (20) μmol/l PDS diluted in Opti-MEM was added, and the cells were incubated at 37°C for 0–90 minutes in a 5% CO2 incubator, and then observed under fluorescence microscopy.
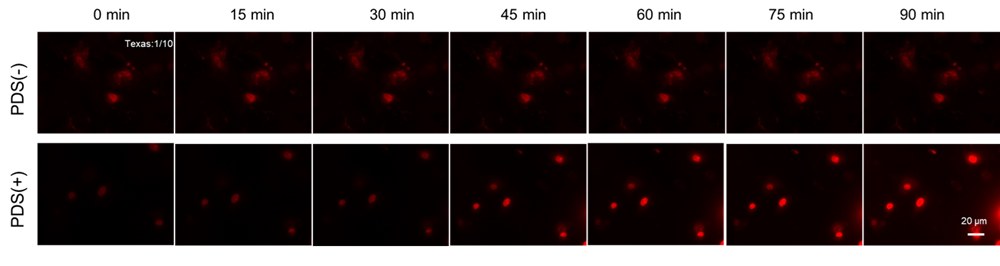 |
| Figure 3. Fluorescence imaging of PDS-treated A549 cells |
The formation of G4 structures in live cells was detected using G-Quadruplex Dye in the presence of PDS, a G4-stabilizing compound. Fluorescence microscopy images were captured every 15 min. Over time, fluorescence at 700 nm increased, confirming the accumulation of G4 structures in the cells.
Experimental Example: Flow cytometric detection of the intracellular G4 in A549 cells treated with Pyridostatin (PDS)
- A549 cells (1.0 x 10⁵ cells/well, MEM containing 10% fetal bovine serum and 1% penicillin-streptomycin) were seeded on a6 well plate and cultured at 37°C 48 hours in a 5% CO2 incubator.
- After the culture medium was removed, the cells were washed once with 2 ml of assay buffer (1x).
- After the supernatant was removed, a working solution (2 ml) was added to the cells.
- The cells were incubated at 37°C in a 5% CO2 incubator for 10 min.
- After the supernatant was removed, the cells were washed with 2 ml of Opti-MEM twice.
- 20 μmol/l PDS diluted in Opti-MEM was added, and the cells were incubated at 37°C for 90 minutes in a 5% CO2 incubator, and then signals were detected by flow cytometry.
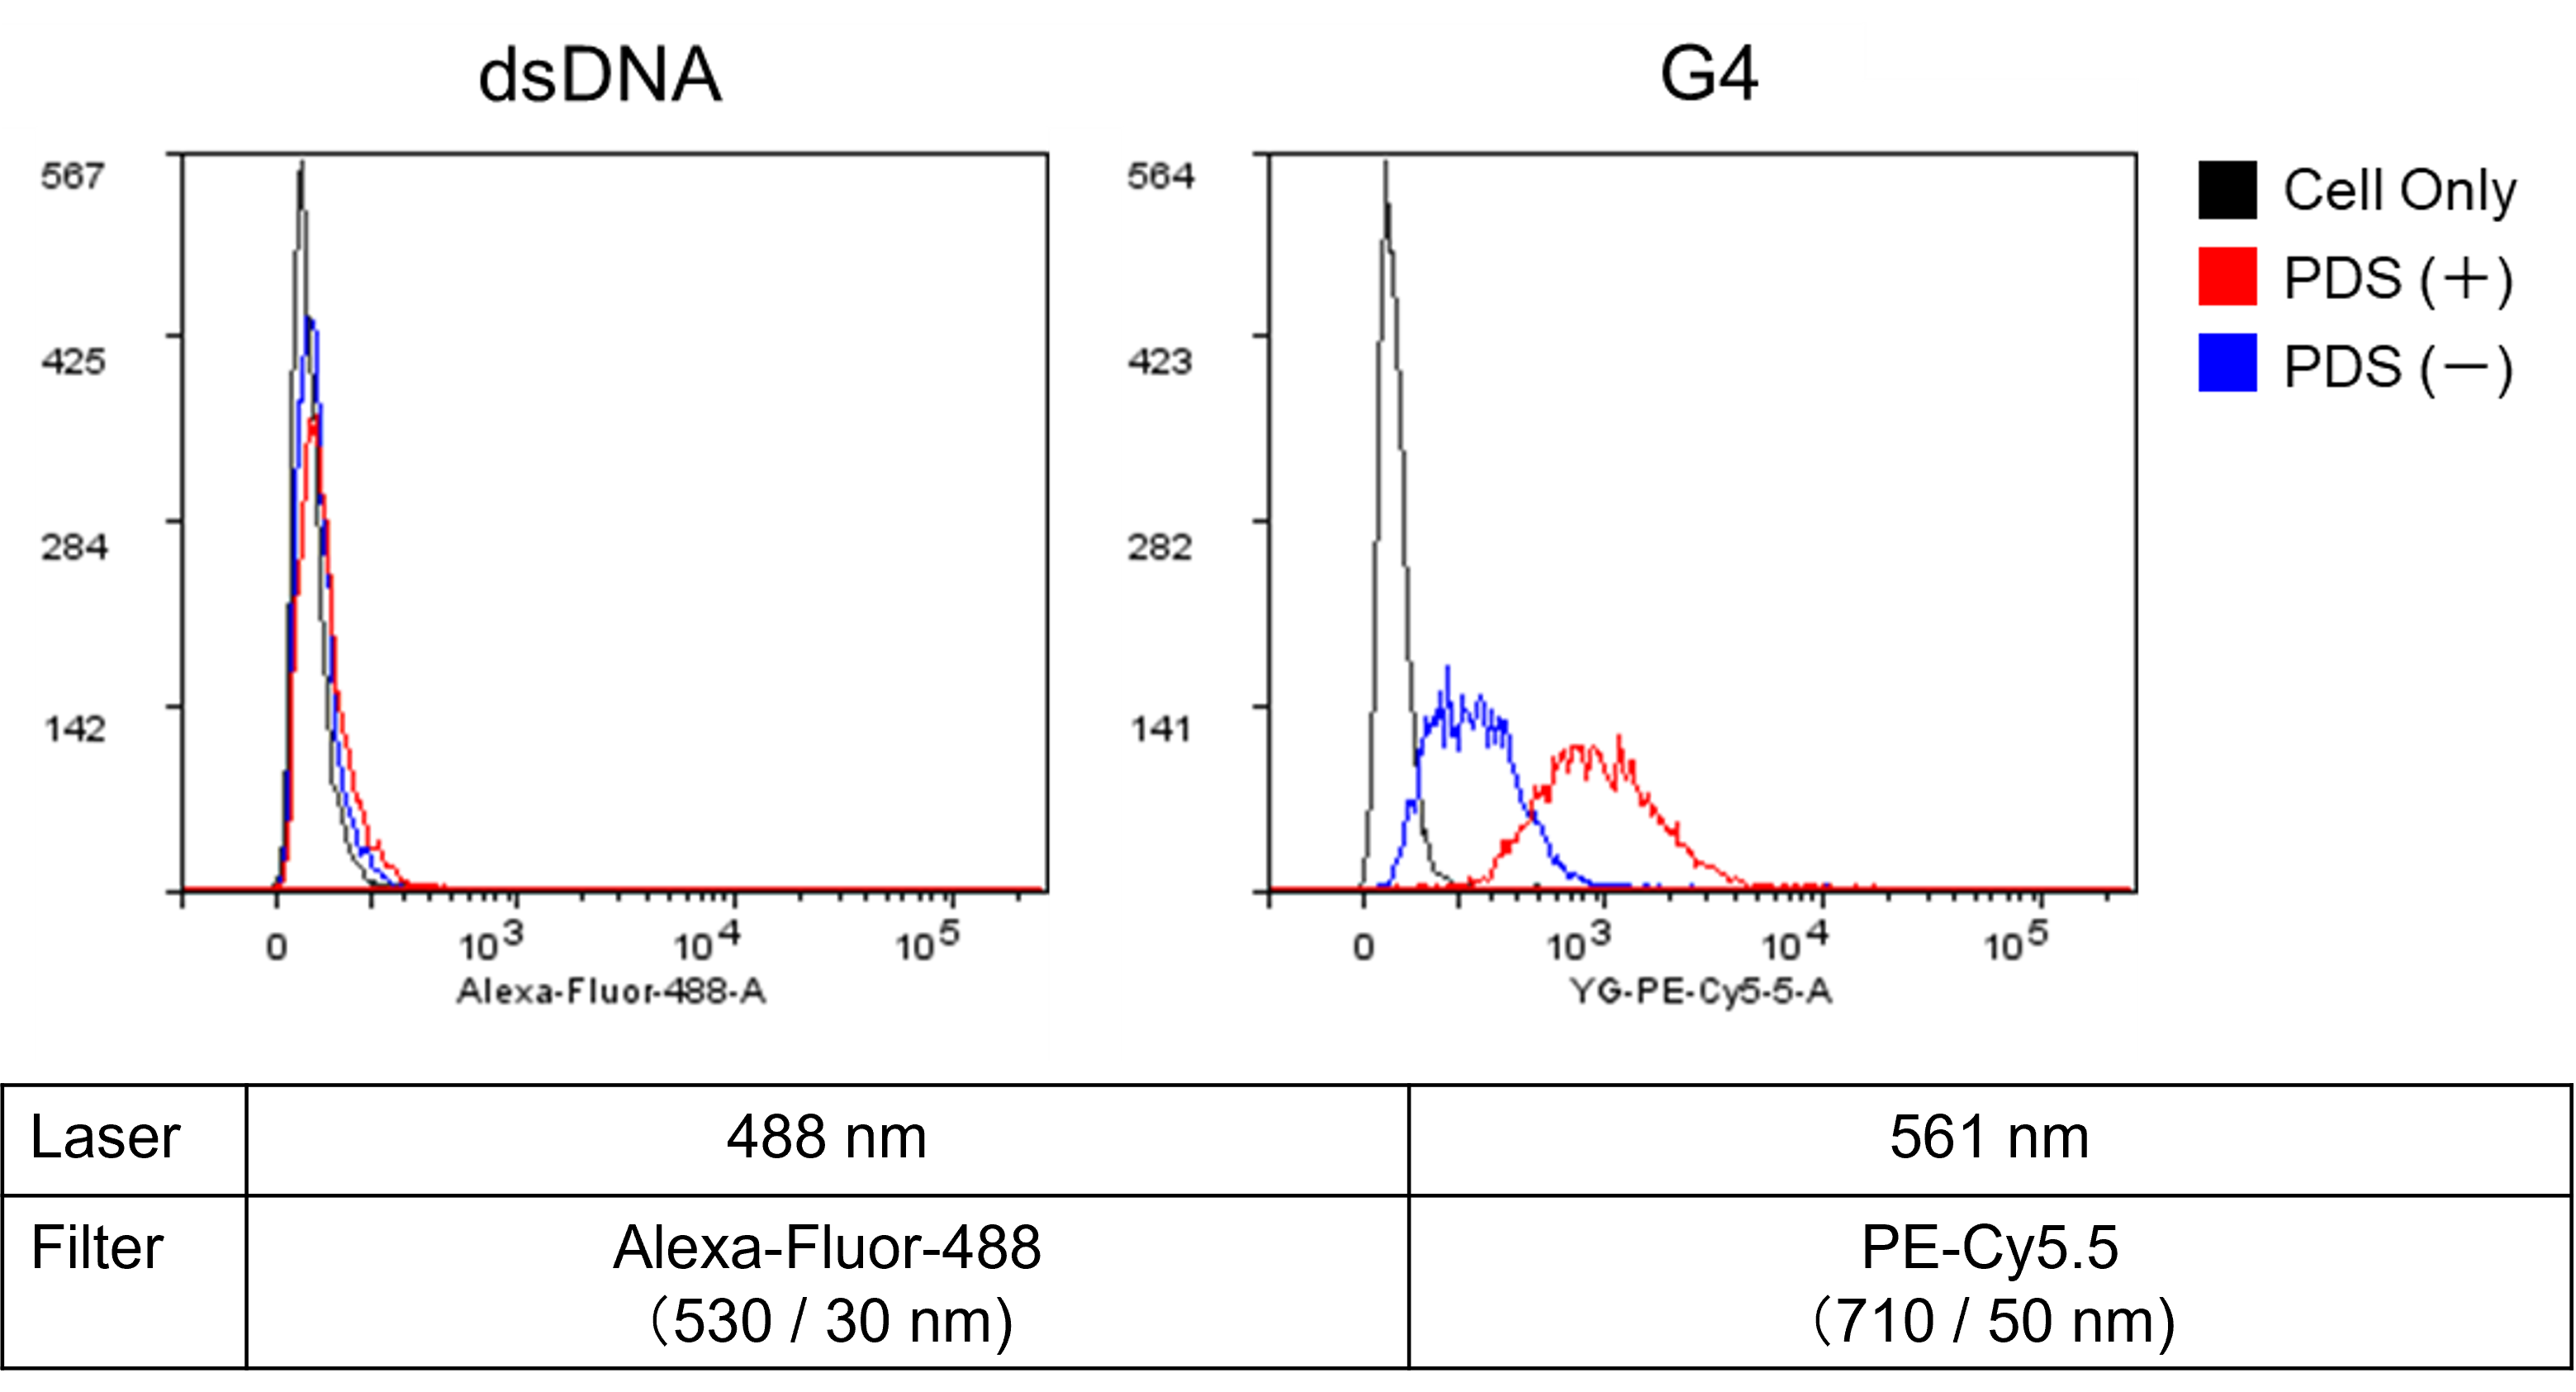
The formation of G4 structures in live cells was detected by flow cytometry using G-Quadruplex Dye in the presence of PDS, a G4-stabilizing compound. After PDS stimulation, fluorescence signals from G-Quadruplex Dye at 700 nm increased, confirming the accumulation of G4 structures in the cells.
Q & A
-
Q
How many samples can be measured with this kit?
-
A
It is possible to test 200 times with a 96 well plate.
-
Q
Does the G-Quadruplex Dye have toxicity to cells?
-
A
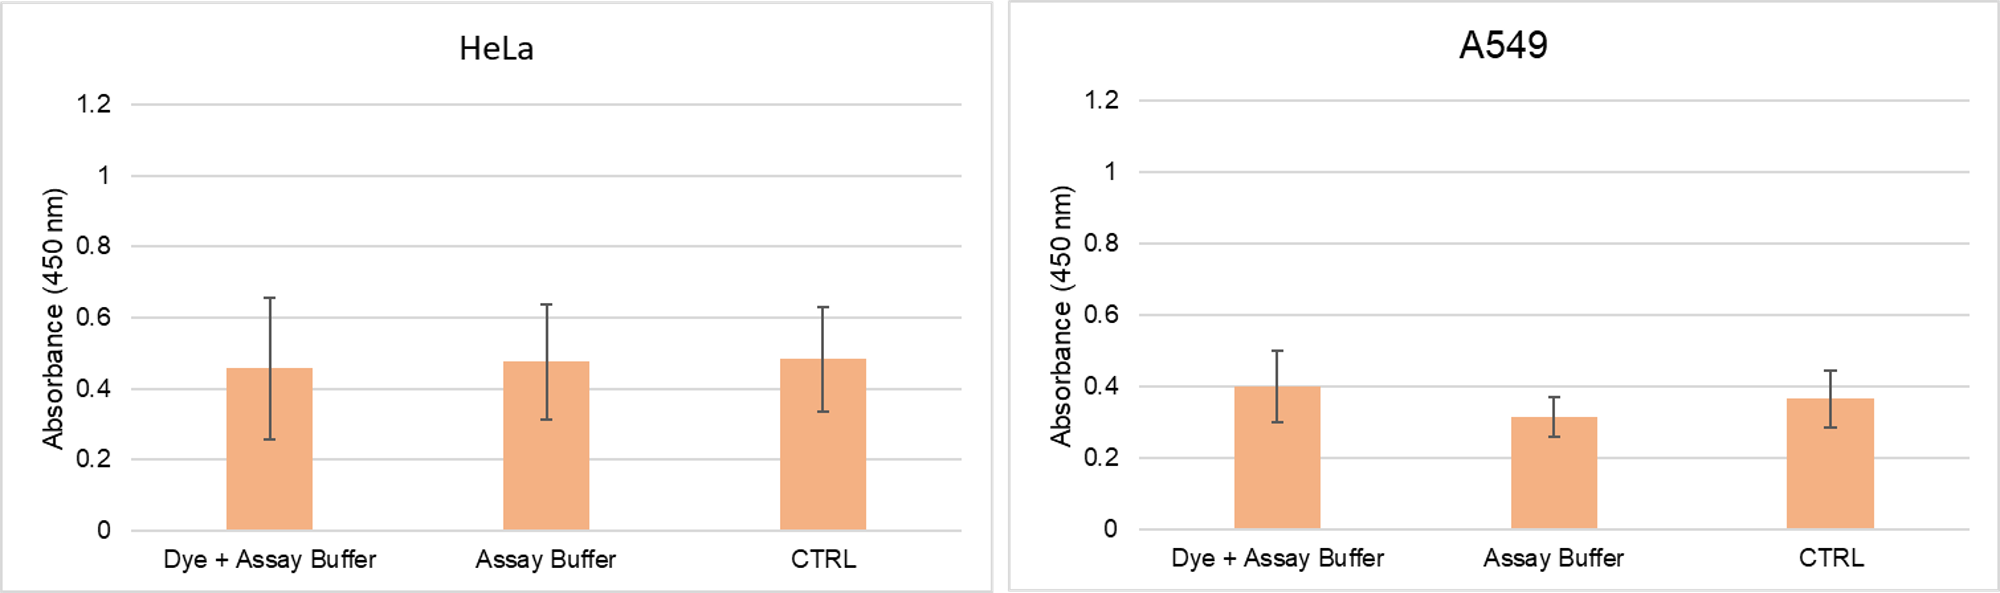
We have conducted a cytotoxicity test using our Cell Counting Kit-8 and confirmed that there is no toxicity when the cells are stained within the recommended concentration range.
-
Q
How stable is working solution?
-
A
working solution can’t be stored. Be sure to use the working solution immediately.
-
Q
Will repeated freezing and thawing of dye solution affect the assay?
-
A
We have confirmed that repeated freeze-thaw cycles of dye solution have no effect on the assay.
-
Q
Can I observe with a flurescence microscope?
-
A
Yes. We recommend that you observe using a confocal microscope, but it is also possible to observe using a transmitted light microscope if you use a filter set that matches the fluorescence characteristics below.

Excitation Emission dsDNA Ex : 450–490 nm Em : 570–640 nm G4 DNA / RNA Ex : 540–580 nm Em : 670–730 nm
Handling and storage condition
| Store at -20 °C | |
|
Danger / harmful symbol mark |

|
|---|---|
Related products
The following related products are also used in research related to this product.


