 Hidden sections will not be printed.
General Information
Nutrient metabolism is necessary for energy production in cells and regulates various cellular functions, including gene expression. Glucose is one of the key substrates for the generation of ATP and sustaining cellular homeostasis. Thus, glucose metabolism has been the subject of intense investigations. In cancer research, tumor cells enhance glucose uptake and consumption for their growth and proliferation. Therefore, elevated glucose uptake is a marker of tumors, and glucose transporters are important targets in cancer treatment.
One standard method for evaluating the glucose uptake ability of cells uses radioisotope-labeled glucose. Although this method has been used for many years, it requires special handling facilities and disposal of radioactive materials. The enzyme cycling method using 2-deoxy-D-glucose, which enables colorimetric and fluorometric plate assays, cannot be applied to cell imaging and flow cytometry. Recently, 2-NBDG, a fluorescently labeled glucose analog, has been used widely to detect cellular glucose uptake by fluorescence imaging and flow cytometry1). However, the sensitivity of this method is poor because of the low fluorescence intensity of 2-NBDG.
To resolve these limitations, novel fluorescent probes, Glucose Uptake Probes, were developed. These probes emit strong fluorescence, allowing highly sensitive detection of cellular glucose uptake by fluorescence imaging, flow cytometry or microplate assay. The WI Solution in these kits enhances cellular retention of the probe to give more reliable data.
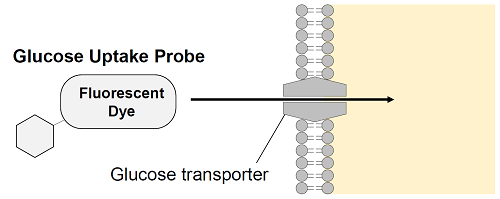
Figure 1. Principle of Glucose Uptake Assay Kit
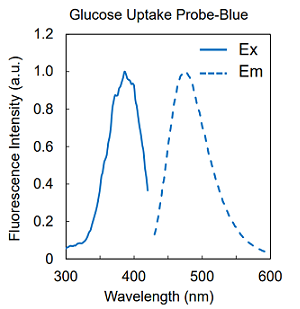
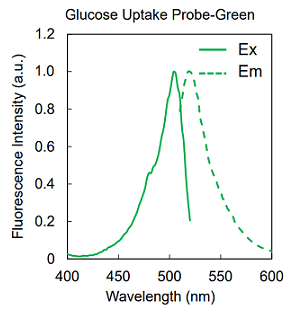
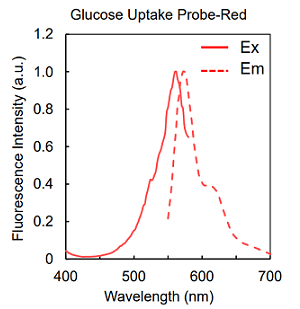
Figure 2. Excitation and emission spectra of Glucose Uptake Probes
Kit Contents
| UP01 | Glucose Uptake Probe-Blue | ×1 |
| WI Solution (50x) | 5 ml ×1 | |
| UP02 | Glucose Uptake Probe-Green | ×1 |
| WI Solution (50x) | 5 ml ×1 | |
| UP03 | Glucose Uptake Probe-Red | ×1 |
| WI Solution (50x) | 5 ml ×1 |
Storage Conditions
Store at 0–5°C
Required Equipment and Materials
- Micropipette
- Dimethylsulfoxide (DMSO)
- HBSS (Hanks’ Balanced Salt Solution)
- Medium (glucose- and serum-free)
- Microtubes (1.5 ml)
Precautions
Tap the tube containing the probe before opening and open it with care. The content may have moved from the bottom of the tube during shipping.
Glucose Uptake Assay Kit-Blue is not applicable for microplate assay.
Preparation of Solutions
1. Preparation of Probe stock solution
Add 40 μl of DMSO to the Glucose Uptake Probe tube and dissolve by pipetting and vortex mixing.
- Store the Probe stock solution at -20°C, protect from light. The Probe stock solution is stable for 1 month.
2. Preparation of Probe solution
Dilute Probe stock solution 500-fold* with glucose- and serum-free medium.
- The optimum concentration of Probe solution varies depending on cell types.
Please refer to the list of cell types on the product HP to determine the optimal concentration (dilution range: x250 - x1000).
| AdherentCells | Suspension Cells | ||||
| Vessel (amount) |
6-well (1.5 ml/well) |
24-well (0.3 ml/well) |
96-well (0.15 ml/well) |
35-mm dish (1.5 ml/well) |
1.5 mlmicrotube (0.5 ml/tube) |
| medium | 1500 μl | 300 μl | 150 μl | 1500 μl | 500 μl |
| Probe stock solution | 3 μl | 0.6 μl | 0.3 μl | 3 μl | 1 μl |
3. Preparation of WI Solution (1x)
Dilute WI Solution (50x) 50-fold with HBSS.
| AdherentCells | Suspension Cells | ||||
| Vessel (amount) |
6-well (1.5 ml/well) |
24-well (0.3 ml/well) |
96-well (0.15 ml/well) |
35-mm dish (1.5 ml/well) |
1.5 mlmicrotube (0.5 ml/tube) |
| HBSS | 6000 μl | 1200 μl | 600 μl | 6000 μl | 2000 μl |
| WI Solution (50x) | 120 μl | 24 μl | 12 μl | 120 μl | 40 μl |
- The indicated volumes are sufficient for three washes and imaging.
Preliminary experiments
Optimization of measurement conditions
Optimization of the measurement conditions is strongly recommended since glucose uptake capacity varies with cell type. When you use this product for the first time, if you are measuring different cell types, please refer to the following general experiments shown below.
- Competitive inhibition of the probe uptake with glucose (see Experimental Example 1)*1
- Inhibition of the probe uptake with glucose transporter inhibitors (see Experimental Example 2)*2
- In some cell types, the cellular probe uptake may not be competitively inhibited with glucose due to differences in expression levels or types of glucose transporters.
Please refer to the Q&A on the product web page for technical tips.
Q, What should I do if competitive inhibition of cellular probe uptake with glucose is not possible? - Please refer to the Q&A on the product web page for glucose transporter inhibitor results.
General Protocol
- Seed cells on a dish or a microplate. Culture the cells at 37°C overnight in a 5% CO2 incubator.
- Remove the culture medium and wash the cells with pre-warmed glucose- and serum-free medium*1 twice.
- Add pre-warmed glucose- and serum-free medium*1 and incubate at 37°C for 15 minutes in a 5% CO2 incubator.
- Remove the supernatant and add pre-warmed Probe solution*1, and incubate at 37°C for 15 minutes*2 in a 5% CO2 incubator.
- Remove the supernatant and wash the cells with ice-cold WI Solution (1x) twice.
- Remove the supernatant, add ice-cold WI Solution (1x), and incubate at room temperature for 5 minutes.*3
- Remove the supernatant and add ice-cold WI Solution (1x).
- Observe the cells under a fluorescence microscope.*4 *5
- Pre-warm the culture medium and Probe solution in an incubator (37°C). Glucose uptake into the cells may be affected by the temperature of the culture medium and Probe solution.
- The optimum staining time varies depending on cell types. Please refer to the list of cell types on the product HP to determine the optimal time (time range: 5 – 60 minutes).
- This step is necessary to avoid a high background.
- When using adherent cells for flow cytometry, prepare a cell suspension using trypsin or a cell scraper.
- When the background fluorescence is high, repeat the washing steps 6 - 7.
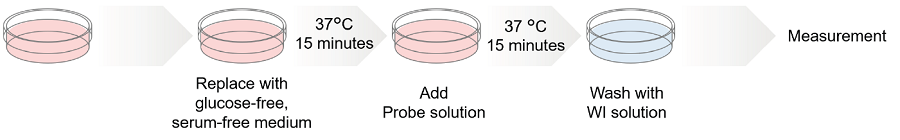
Figure 3. Protocol of Glucose Uptake Assay Kit
Experimental Example 1
Competitive inhibition of the probe uptake with D-glucose (A549 cells)
1-1. Fluorescence microscopy and microplate reading
- A549 cells (1.0 × 10⁵ cells/ml, 150 μl) in MEM (10% FBS) were seeded in a 96-well microplate (ib89626 : ibidi GmbH) and cultured at 37°C overnight in a 5% CO2 incubator.
- After removing the supernatant, the cells were washed twice with 150 μl of DMEM (glucose- and serum-free, 37°C).
- DMEM (150 μl, glucose- and serum-free, 37°C) was added and the cells were incubated at 37°C for 15 minutes in a 5% CO2 incubator.
- After removing the supernatant, 150 μl of Probe solution in DMEM (glucose- and serum-free, 37°C) or DMEM (high-glucose, serum-free, 37°C) were added and the cells were incubated at 37°C for 15 minutes in a 5% CO2 incubator.
- After removing the supernatant, the cells were washed three times with 150 μl of WI Solution (1x, 4°C).
- The cells were observed under a fluorescence microscope (BZ-X700, Keyence Corporation) and the fluorescence intensity was measured with a microplate reader (Infinite m200 PRO, Tecan Trading AG, bottom reading).
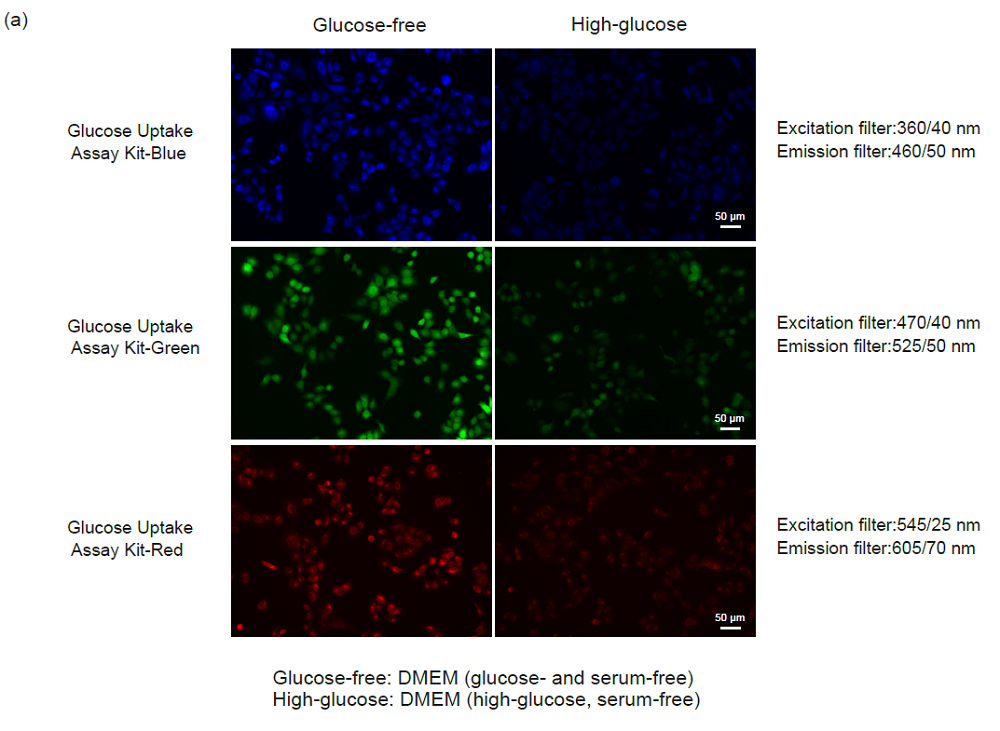
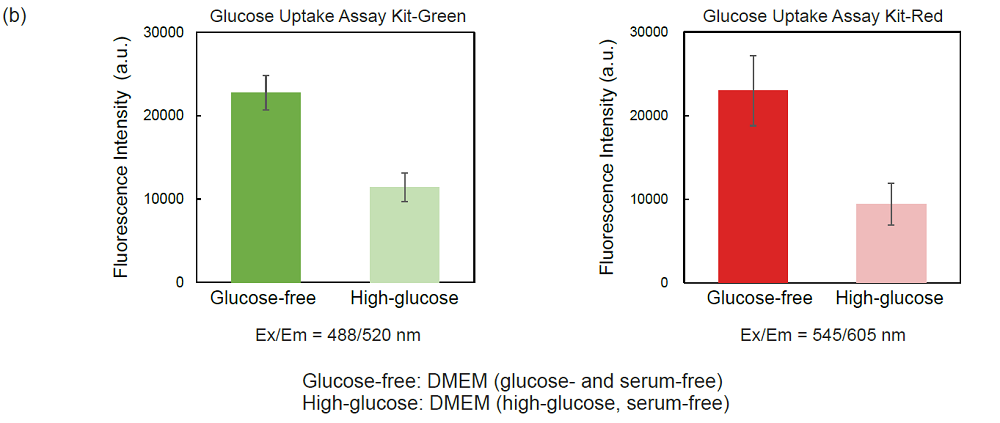
Figure 4. Competitive inhibition of the probe uptake with D-glucose (A549 cells)
(a) Fluorescence imaging, (b) plate reading.
1-2. Flow cytometry
- A549 cells (1.33 × 10⁵ cells/ml, 1.5 ml) in MEM (10% FBS) were seeded in a 6-well microplate (3810-006, AGC Techno Glass Co., Ltd.) and cultured at 37°C overnight in a 5% CO2 incubator.
- After removing the supernatant, the cells were washed twice with 1.5 ml of DMEM (glucose- and serum-free, 37°C).
- DMEM (1.5 ml, glucose- and serum-free, 37°C) was added and the cells were incubated at 37°C for 15 minutes in a 5% CO2 incubator.
- After removing the supernatant, 1.5 ml of Probe solution in DMEM (glucose- and serum-free, 37°C) or DMEM (high-glucose, serum-free, 37°C) were added and the cells were incubated at 37°C for 15 minutes in a 5% CO2 incubator.
- After removing the supernatant, the cells were washed three times with 1.5 ml of WI Solution (1x, 4°C).
- WI Solution (1x, 1.5 ml, 4°C) was added and the cells were harvested using a cell scraper.
- The cells were kept in an ice bath until the measurement.
- The cells were measured using a flow cytometer (LSR-Fortessa X-20, Becton, Dickinson and Company).
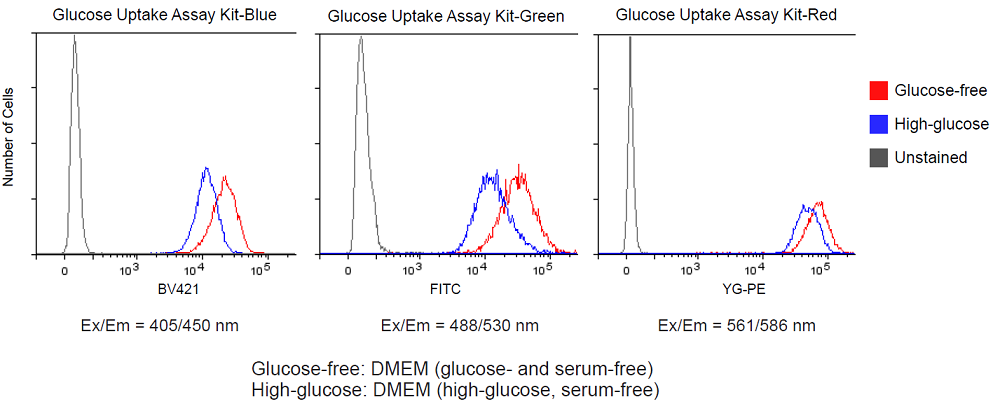
Figure 5. Competitive inhibition of the probe uptake with D-glucose (A549 cells) measured by flow cytometry
Experimental Example 2
Inhibition of the probe uptake with Cytochalasin B (HepG2 cells)
- HepG2 cells (3.0 × 10⁵ cells/ml, 150 μl) in MEM (10% FBS) were seeded in a 96-well microplate (ib89626 : ibidi GmbH) and cultured at 37°C overnight in a 5% CO2 incubator.
- After removing the supernatant, 150 μl of MEM (10% FBS, 37°C) containing 0 or 5 μmol/l Cytochalasin B were added, and the cells were incubated at 37°C overnight in a 5% CO2 incubator.
- After removing the supernatant, the cells were washed twice with 150 μl of DMEM (glucose- and serum-free, 37°C).
- DMEM (150 μl, glucose- and serum-free, 37°C) was added, and the cells were incubated at 37°C for 15 minutes in a 5% CO2 incubator.
- After removing the supernatant, 150 μl of Probe solution in DMEM (glucose- and serum-free, 37°C) were added and the cells were incubated at 37°C for 15 minutes in a 5% CO2 incubator.
- After removing the supernatant, the cells were washed three times with 150 μl of WI Solution (1x, 4°C).
- The cells were observed under a fluorescence microscope (BZ-X700, Keyence Corporation) and the fluorescence intensity was measured with a microplate reader (Infinite m200 PRO, Tecan Trading AG, top reading).
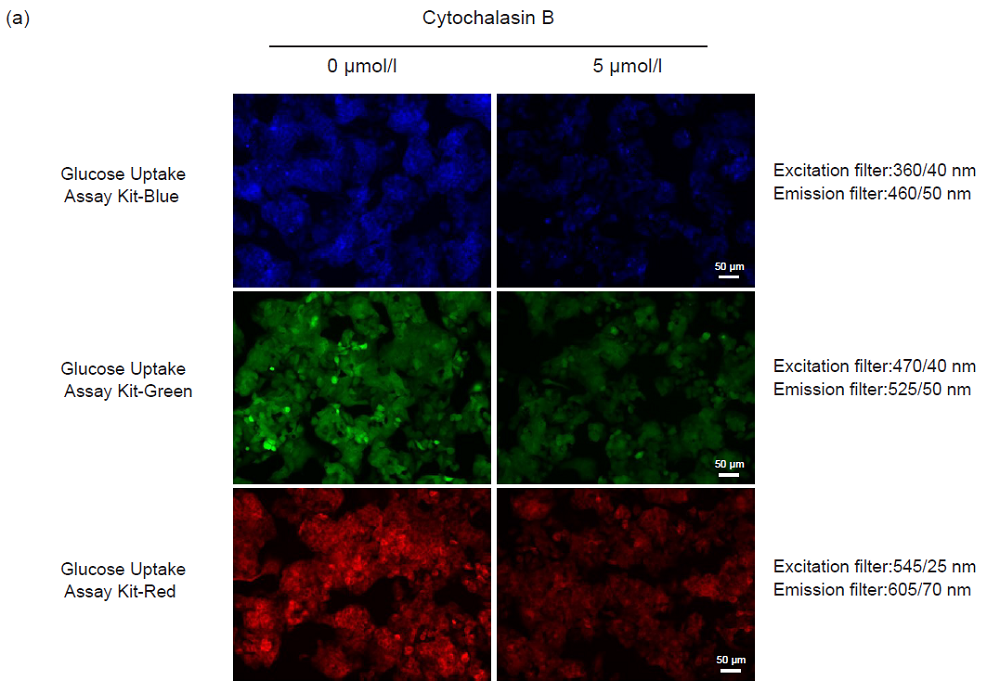
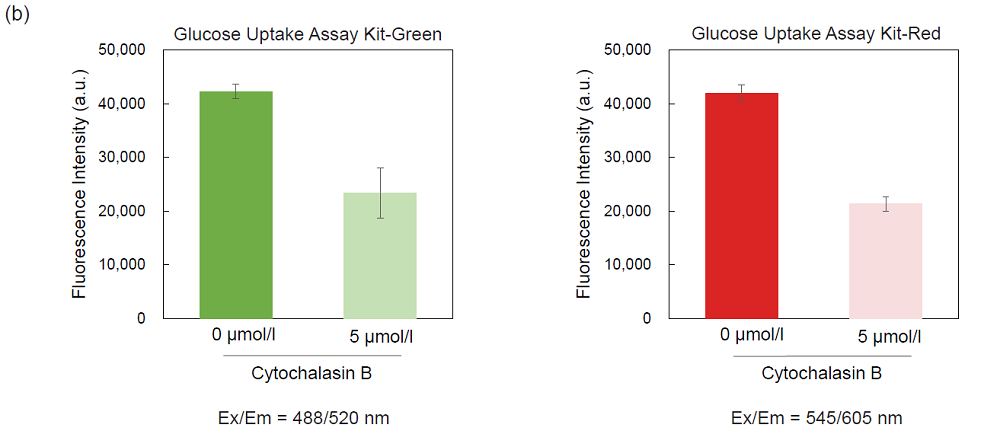
Figure 6. Inhibition of the probe uptake by Cytochalasin B (HepG2 cells)
(a) Fluorescence imaging, (b) plate reading.
Experimental Example 3
Measurement of increased uptake glucose level followed by adipocyte differentiation
-Adipocyte differentiation-
- 3T3-L1 cells (1.0 × 10⁵ cells/ml, 150 μl) in DMEM (10% FBS) were seeded in a 96-well microplate (ib89626: ibidi GmbH) and cultured at 37°C in a 5% CO2 incubator.
- The cells were cultured until the confluence. The culture medium was exchanged every 2 days interval.
- Cells prepared without the following steps 3 and 4 were used as preadipocytes.
- After removing the supernatant, 150 μl of DMEM (5.5 mmol/l glucose, 10% FBS) containing 1 μmol/l dexamethasone and 0.5 mmol/l 3-isobutyl-1-methylxanthine were added and the cells were cultured at 37°C for 2 days in a 5% CO2 incubator.
- After removing the supernatant, 150 μl of DMEM (5.5 mmol/l glucose, 10% FBS) containing 1.72 μmol/l insulin was added and the cells were cultured at 37°C for 2 days in a 5% CO2 incubator.
- After removing the supernatant, 150 μl of DMEM (5.5 mmol/l glucose, 10% FBS) were added and the cells were cultured at 37°C for 6 days in a 5% CO2 incubator. The culture medium was exchanged every 2 days interval during the cell culture.
-Uptake of the probe by preadipocytes and adipocytes-
- After removing the supernatant, the cells were washed twice with 150 μl of DMEM (glucose- and serum-free, 37°C).
- DMEM (glucose- and serum-free, 37°C, 150 μl) was added and the cells were incubated at 37°C for 15 minutes in a 5% CO2 incubator.
- After removing the supernatant, 150 μl of Probe solution in DMEM (glucose- and serum-free, 37°C) was added and the cells were incubated at 37°C for 15 minutes in a 5% CO2 incubator.
- After removing the supernatant, the cells were washed three times with 150 μl of WI Solution (1x, 4°C).
- The cells were observed under a fluorescence microscope (BZ-X700, Keyence Corporation).
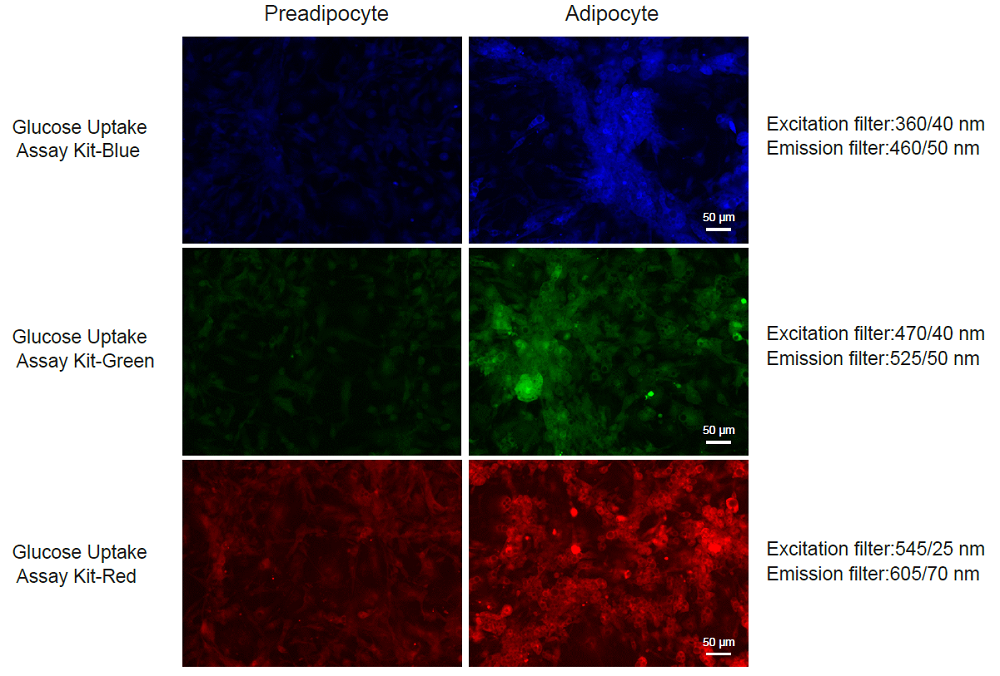
Figure 7. Enhancement of glucose uptake by differentiation
Reference
- Yoshioka, K.; Takahashi, H.; Homma, T.; Saito, M.; Oh, B. K.; Nemoto, Y.; Matsuoka, H. "A novel fluorescent derivative of glucose applicable to the assessment of glucose uptake activity of Escherichia coli. Biochim" Biophys. Acta, 1996, 1289, 5-9.
UP01_UP02_UP03: Glucose Uptake Assay Kit-Blue/Green/Red
Revised Jun., 16, 2023