 Hidden sections will not be printed.
General Information
Mitochondria is one of the important organelles in discussing early cytotoxicity, oxidative stress and apoptosis in vivo1). Mitochondria synthesize ATP using oxygen to produce necessary energy for living cells. Lowering of mitochondrial activity and dysfunction are known to be closely related to cancer, aging, and neurodegenerative diseases such as Alzheimer’s and Parkinson’s diseases2), 3).
JC-1 is widely used for observing mitochondrial membrane potential, shows fluorescence characteristic change from green (530 nm) to red (590 nm) depending on the mitochondrial membrane potential.
A red/green fluorescence intensity ratio of JC-1 decreases in depolarized mitochondria due to disruption of red fluorescent J-aggregates.
Unlike commercially available JC-1, no precipitation of JC-1 in aqueous buffer occurs by using this kit. In addition, the Imaging Buffer including in this kit minimizes fluorescence background and maintains the cells being healthy during assays.
Kit Contents
| JC-1 Dye | 100 nmol x 1 |
| Imaging Buffer (10x) | 11 ml x 1 |
Storage Condition
Store at 0–5 ℃.
Required Equipment and Materials
- Dimethyl sulfoxide (DMSO)
- Medium or HBSS
- Micropipettes
- Microtube
Preparation of Solutions
Preparation of Imaging Buffer solution
Dilute Imaging Buffer (10x) 10 times using double-deionized water.
Use the Imaging Buffer solution within the day.
Table 1 Required amount of Imaging Buffer solution by vessel type
| Vessel | 35 mmdish | ibidi 8 well plate |
| Appropiate amount | 2 ml/dish | 200 μl/well |
| Vessel | 96 well plate | Sample tube (Flow Cytometry) |
| Appropiate amount | 100 μl/well | 0.5 ml/sample |
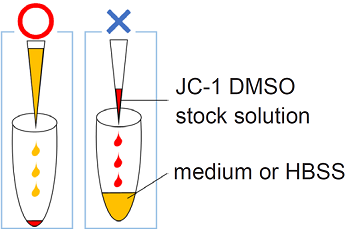
Preparation of JC-1 DMSO stock solution (2 mmol/l)
Add 50 μl of DMSO to a tube of JC-1 Dye and dissolve the red-purple solid by pipetting.
Store the JC-1 DMSO stock solution at -20 ℃.
- Protect the JC-1 DMSO stock solution from light.
- JC-1 DMSO stock soltuion is stable at -20℃ for up to one month.
Preparation of JC-1 working solution
Take a necessary amount of the JC-1 DMSO stock solution with a micropipette and transfer it to a microtube.
Add appropriate amount of medium to the tube, then mix immediately by 10 times of pipetting.
Adjust the final concentration of JC-1 in the range of 1–15 μmol/l.
-
- To prepare a homogeneous working solution, please exactly follow the preparing procedure above.
- Equilibrate both DMSO stock solution and culture medium to room temperature before preparing a working solution.
- When the fluorescence signal is week, optimize the concentration of JC-1 in working solution and incubation time.
- Use the JC-1 working solution within the day.
General protocol
Mitochondrial membrane potential determination using JC-1
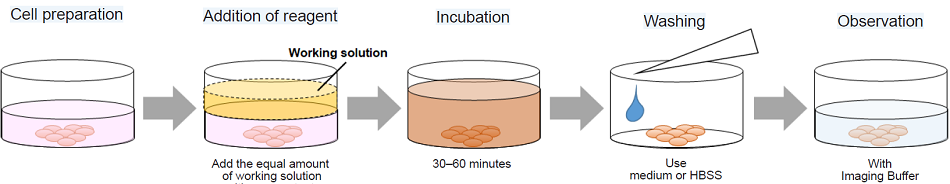
- Inoculate cells into a dish or a chamber slide and incubate the cells at 37 ℃ in a 5% CO2 incubator.
- Add an appropriate volume of JC-1 working solution to wells.*1
- Incubate the cells at 37 ℃ in the 5% CO2 incubator for 30–60 minutes.
- Discard the supernatant and wash the cells with medium or HBSS twice.*2
- Add Imaging Buffer solution and observe the cells under a fluorescence microscope.*3
- Do not wash the cells after depolarization with CCCP or FCCP because the washing step might change mitochondrial membrane potential.
- Do not use PBS for washing to avoid a damege to the cells.
- Do not irradiate the excitation light to the sample for long time. JC-1 dye is light sensitive.
Example: Staining procedure with JC-1 (as 2 μmol/l of final concentration)
Transfer 2 μl of JC-1 DMSO stock solution (2 mmol/l) to a microtube.
Add 1 ml of medium to the tube, then mix immediately by 10 times of pipetting.
Add the equal amount of JC-1 working solution with supernatant to a well or dish.
Usage examples
Fluorescence microscopic detection of mitochondrial membrane potential in HeLa cells treated with Carbonyl cyanide m-chlorophenyl hydrazone (CCCP)
- HeLa cells (2.4x10⁵ cells/ml, 200 μl) in MEM (10% fetal bovine serum, 1% penicillin-streptomycin) were seeded on a μ-slide 8 well plate (ibidi) and were cultured at 37 ℃ in a 5% CO2 incubator overnight.
- The medium was removed and CCCP in MEM (0 or 100 μmol/l, 200 μl) was added to each well, and then the cells were cultured at 37 ℃ for 90 minutes in the 5% CO2 incubator.
- After the supernatant (100 μl) was removed, JC-1 working solution (4 μmol/l, 100 μl) was added, then the cells were cultured at 37 ℃ for 30 minutes in the 5% CO2 incubator.
- The cells were washed with 200 μl of HBSS twice.
- Imaging Buffer solution (200 μl) was added, and the cells were observed under a fluorescence microscope.
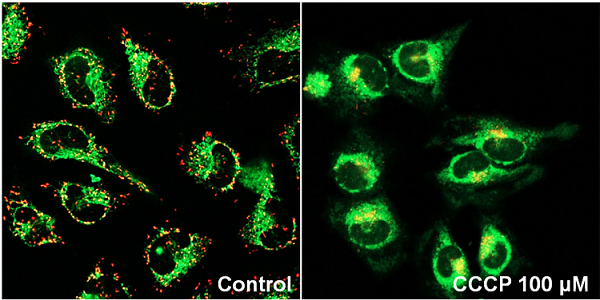
| Fluorescence imaging: Green Ex: 488 nm, Em: 500–550 nm Red Ex: 561 nm, Em: 560–610 nm |
Figure 1 Fluorescence imaging of mitochondrial membrane potential in HeLa cells
Fluorescence microscopic detection of mitochondrial membrane potential in HeLa cells treated with Carbonyl cyanide-p-trifluoromethoxyphenyl hydrazone (FCCP)
- HeLa cells (2.4x10⁵ cells/ml, 200 μl) in MEM (10% fetal bovine serum, 1% penicillin-streptomycin) were seeded on a μ-slide 8 well plate (ibidi) and were cultured at 37 ℃ in a 5% CO2 incubator overnight.
- The medium was removed and FCCP in MEM (0 or 100 μmol/l, 200 μl) was added to each well, and then the cells were cultured at 37 ℃ for 30 minutes in the 5% CO2 incubator.
- After the supernatant (100 μl) was removed, JC-1 working solution (4 μmol/l, 100 μl) was added, then the cells were cultured at 37 ℃ for 30 minutes in the 5% CO2 incubator.
- The cells were washed with 200 μl of HBSS twice.
- Imaging Buffer solution (200 μl) was added, and the cells were observed under a fluorescence microscope.
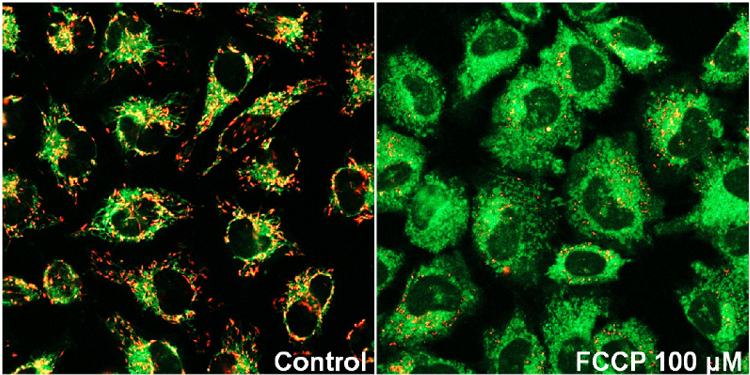
| Fluorescence imaging: Green Ex: 488 nm, Em: 500–550 nm Red Ex: 561 nm, Em: 560–610 nm |
Figure 2 Fluorescence imaging of mitochondrial membrane potential in HeLa cells
Mitochondrial membrane potential detection of apoptosis-induced Jurkat cells
- Jurkat cells (1.0x10⁶ cells/ml, 2 ml) in RPMI (10% fetal bovine serum, 1% penicillin-streptomycin) were transfered to a 5 mL tube.
- The medium was removed and staurosporine in RPMI (0 or 2.5 μg/l, 2 ml) was added to each tube, and then the cells were incubated at 37 ℃ for 150 minutes in a 5% CO2 incubator.
- JC-1 working solution (4 μmol/l, 2 ml) was added, then the cells were incubated at 37 ℃ for 30 minutes in the 5% CO2 incubator.
- The media was removed and the cells were washed with 200 μl of HBSS twice.
- Imaging Buffer solution (2 ml) was added, and the cells were observed under a fluorescence microscope, and analyzed using a plate reader or a flow cytometer.
Fluorescence imaging
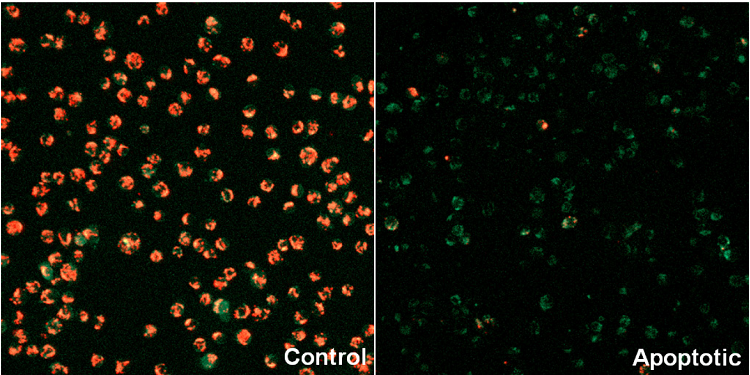
| imaging filter: Green 488 nm (Ex), 500–550 nm (Em) Red 561 nm (Ex), 560–610 nm (Em) |
Figure 3 Fluorescence imaging of mitochondrial membrane potential in Jurkat cells
Plate Reader Detection
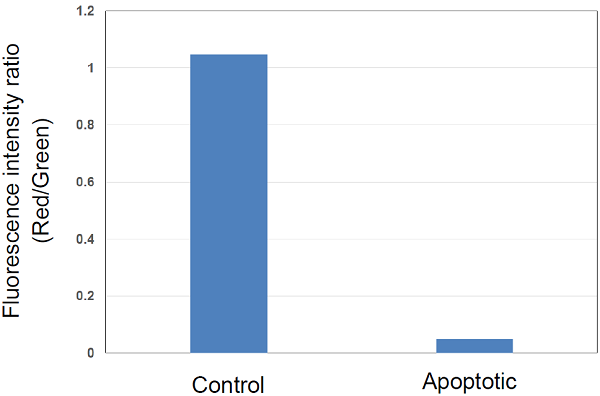
| Green 485 nm (Ex), 525–545 nm (Em) Red 535 nm (Ex), 585–605 nm (Em) NuncTM MicroWellTM 96-Well Optical Bottom Plates with Polymer Base (cat# 165305) |
Figure 4 Fluorescence intensity ratio of mitochondrial membrane potential in Jurkat cells
Flow Cytometry
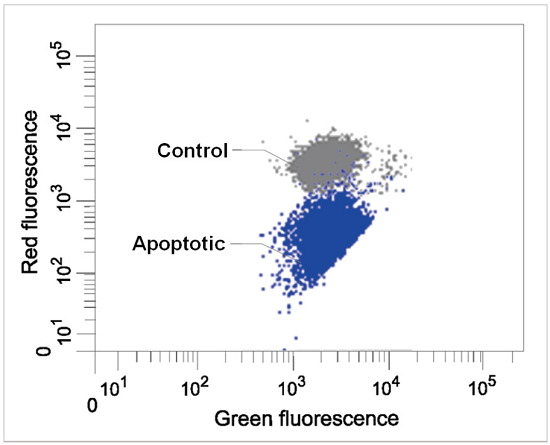
| filter settings Green 488 nm (Ex), 515–545 nm (Em) Red 488 nm (Ex), 564–604 nm (Em) |
Figure 5 Flow cytometric analysis of mitochondrial membrane potential in Jurkat cells
References
- Ferri, K. F. et al., J. Exp. Med., 2000, 192, 1081–1092.
- Matsuda, N. et al., J. Cell Biol., 2010, 189, 211.
- Wang, J. L. et al., PNAS, 2000, 97, 7124–7129.
- Birju, P. S. et al., ACSNano, 2014, 8, 9, 9379–9387.
- Cristiana, F. et al., JID, 2000, 115, 5, 835–841.
Frequently Asked Questions / Reference


MT09: JC-1 MitoMP Detection Kit
Revised May., 31, 2023