 Hidden sections will not be printed.
General Information
Lipid peroxides are derived from the oxidation of unsaturated fatty acids by reactive oxygen species. The generated lipid peroxides in turn oxidize lipids, resulting in a chain reaction that increases the amount of lipid peroxides. In addition, when high levels of Fe2+ are present, lipid peroxides are generated by the reactions of Fe2+ and reactive oxygen species. Lipid peroxides are decomposed into highly reactive aldehydes, such as acrolein, malondialdehyde (MDA), and 4-hydroxy-2-nonenal (4-NHE), which are known to cause cytotoxicity and cell death. Thus, lipid peroxidation causes various diseases, such as atherosclerosis1).
Lipid Peroxidation Probe -BDP 581/591 C11- is a fluorescent dye used to detect the formation of lipid peroxides. This fluorescent dye does not respond to lipid peroxides, but reacts with lipid radicals formed during lipid peroxidation by reactive oxygen species. Thus, BDP 581/591 C11 can be used to observe the formation of lipid peroxides with the fluorescence color changing from red to green depending on the state of lipid peroxidation. This fluorescent dye allows the detection of the formation of lipid peroxides with high sensitivity because of the high signal-to-noise of the fluorescence signals.
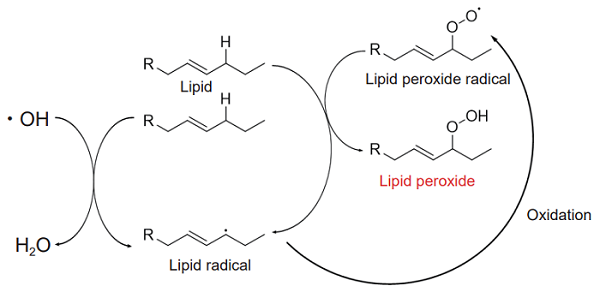
Figure 1. Mechanism of lipid peroxidation
Contents
| Lipid Peroxidation Probe -BDP 581/591 C11- | 200 tests x 1 |
Storage Condition
Store in a cool and dark place.
Required Equipment and Materials
- Fluorescence microscope, fluorescence plate reader, or flow cytometer
- Incubator (37℃)
- Micropipettes (100–1000 μl, 20–200 μl, 1–10 μl)
- Microtubes
- Hanks' balanced salt solution (HBSS)
- Dimethyl sulfoxide (DMSO)
Precaution
Centrifuge the tube briefly before opening the cap because the content may be on the tube wall or the ceiling of the cap.
Please refer to Table 1 to check suitable fluorescence wavelengths for each application.
| Applications | Fluorescence plate reader | Fluorescence microscope | Flow cytometer |
|
Fluorescence color: |
Ex/Em: 480-500/520-540 nm |
・Confocal microscope Ex/Em: 488/510-550 nm ・Fluorescence microscope GFP or FITC filter |
FITC filter |
| Fluorescence color: Red |
Ex/Em: 550-570/590-610 nm |
・Confocal microscope Ex/Em: 561/600-630 nm ・Fluorescence microscope TexasRed or Cy3 filter |
Cy3 filter |
Preparation of Solutions
Preparation of BDP 581/591 C11 DMSO stock solution
Add 20 μl of DMSO to the tube containing Lipid Peroxidation Probe -BDP 581/591 C11- by pipetting. Ensure that the probe is dissolved in the solvent.
- Store the reconstituted BDP 581/591 C11 DMSO stock solution at −20℃ until use. The solution is stable at −20℃ for 1 month.
Preparation of BDP 581/591 C11 working solution
Dilute the BDP 581/591 C11 DMSO stock solution (1:2000) with the serum free medium to prepare BDP 581/591 C11 working solution.
- If serum-free medium affects cell damage, it is possible to change to serum-containing medium.
When serum-containing medium is used, a 1000-fold dilution is recommended. - The serum may affect the test substance used. Please refer to the FAQ ‘What medium should I use to dilute the working solution?’.
- Optimal concentration may vary depending on the cell type. Please refer to the FAQ ‘What is the optimal concentration?’.
- The working solution cannot be stored and must be prepared freshly on the day of use.
Refer to Table 2 for the preparation of the working solution by vessel type.
| Vessel | 35-mm dish | ibidi 8-well plate | 96-well clear black plate (clear bottom) | Flow cytometer |
| Appropriate amount | 2 ml/dish | 200 μl/well | 100 μl/well | 0.5 ml/tube |
General protocol
- Seed cells on dishes or plates and place them in an incubator at 37℃ equilibrated under 95% air and 5% CO2.
Note: Refer to Table 3 to check the recommended vessels for each detector.Table 3. Recommended vessels by the detector
Detector Fluorescence plate reader Fluorescence microscope Flow cytometer Vessel 96-well black plate (clear bottom) 96-well black plate (clear bottom)
ibidi 8-well plate
35-mm dish6-well plate - Discard the culture medium and wash the cells twice with the culture medium.
- Add an appropriate volume of BDP 581/591 C11 working solution to the cells.
- Incubate the cells as in step 1 for 30 minutes.
- Discard the working solution and wash the cells twice with HBSS.
- Add the culture medium or HBSS containing stimulation agents and incubate at 37℃ for an appropriate time.
- Discard the supernatant, wash the cells twice with HBSS, add HBSS, and observe fluorescence signals
Note: Perform steps 3 and 6 in reverse order if dye staining after drug stimulation is needed.
Usage examples
Detection of lipid peroxidation in HepG2 cells treated with t-BHP (tert-butyl hydroperoxide)
- HepG2 cells (2×10⁵ cells/ml) in MEM (supplemented with 10% fetal bovine serum and 1% penicillin-streptomycin) were seeded into vessels and incubated overnight at 37℃ under 95% air and 5% CO2.
- (ibidi 8-well plate: 200 μl/well, 96-well black plate (clear bottom): 100 μl/well, 6-well plate: 2 ml/well)
- The culture medium was removed, and the cells were washed twice with the culture medium.
- After removing the supernatant, BDP 581/591 C11 working solution was added and the cells were cultured for 30 minutes as in step 1.
- (ibidi 8-well plate: 200 μl/well, 96-well black plate (clear bottom): 100 μl/well, 6-well plate: 2 ml/well)
- After removing the supernatant, the cells were washed twice with HBSS.
- The supernatant was removed, 200 μmol/l t-BHP in HBSS was added to each well, and the cells were cultured for 2 hours as in step 1.
- (ibidi 8-well plate: 200 μl/well, 96-well black plate (clear bottom): 100 μl/well, 6-well plate: 2 ml/well)
- The cells were washed twice with HBSS, and the vessels were refilled with HBSS.
- Fluorescence signals were measured using a plate reader and a flow cytometer, and images were obtained using a fluorescence microscope.
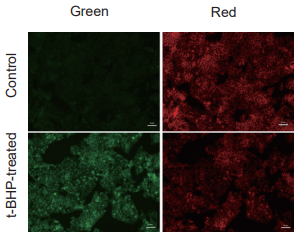
Detection: Fluorescence microscope
Green: GFP filter
(Ex: 470/40 nm, Em: 525/50 nm)
Red: TexasRed filter
(Ex: 560/40 nm, Em: 630/75 nm)
Scale bar: 50 μm
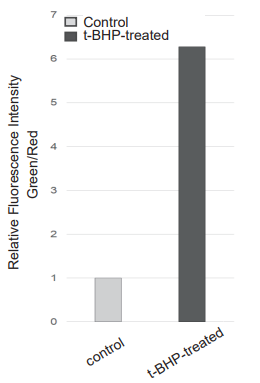
Detection: Plate reader
Green: Ex/Em: 490/530 nm
Red: Ex/Em: 570/610 nm
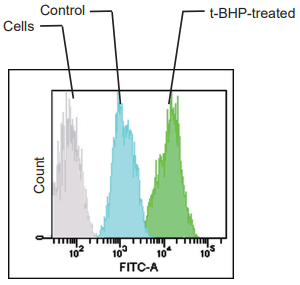
Detection: Flow cytometer
Filter: FITC filter (Ex: 488 nm, Em: 530/30 nm)
Figure 2. Fluorescence signals from HepG2 cells detected with a fluorescence microscope,
flow cytometer, and plate reader
Detection of lipid peroxidation in HepG2 cells treated with cumene hydroperoxide
- HepG2 cells (2×10⁵ cells/ml) in MEM (supplemented with 10% fetal bovine serum and 1% penicillin-streptomycin) were seeded on ibidi 8-well plates and cultured overnight at 37℃ under 95% air and 5% CO2.
- The culture medium was removed, and the cells were washed twice with the culture medium.
- After removing the supernatant, BDP 581/591 C11 working solution was added, and the cells were cultured for 30 minutes as in step 1.
- After removing the supernatant, the cells were washed twice with HBSS.
- The supernatant was removed, 200 μmol/l cumene hydroperoxide in HBSS was added to each well, and the cells were cultured for 2 hours as in step 1.
- The cells were washed twice with HBSS, and the vessels were refilled with HBSS.
- The cells were observed under a fluorescence microscope.
|
|
Detection: Fluorescence microscope Green: GFP filter (Ex: 470/40 nm, Em: 525/50 nm) Red: TexasRed filter (Ex: 560/40 nm, Em: 630/75 nm) Scale bar: 50 μm |
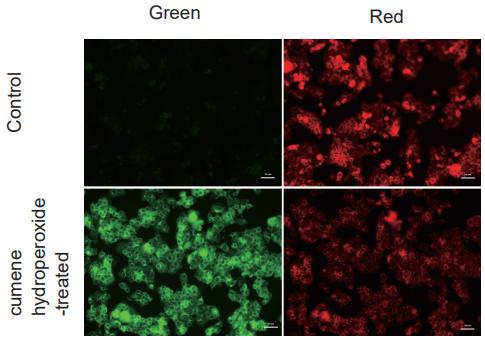
Figure 3. Fluorescent images of HepG2 cells treated with cumene hydroperoxide.
Reference
- S. J. Dixon et al., Cell, 2012, 149, 1060
Frequently Asked Questions / Reference


L267: Lipid Peroxidation Probe -BDP 581/591 C11-
Revised Feb., 26, 2025