 Hidden sections will not be printed.
General Information
Aerobic organisms mainly produce ATP by mitochondrial oxidative phosphorylation; because oxygen (O2) is consumed in this process, it is one of the substances that is essential for our energy production. Meanwhile, chronic hypoxia in cells can lead to cancer and ischemic diseases.
The Intracellular Oxygen Detection Kit enables the measurement of oxygen concentration changes (phosphorescence lifetime changes) in cultured cells. The kit includes an Intracellular Oxygen Probe, which increases phosphorescence intensity when the oxygen concentration in the cell decreases, and Mineral Oil to block the influx of oxygen from the air.
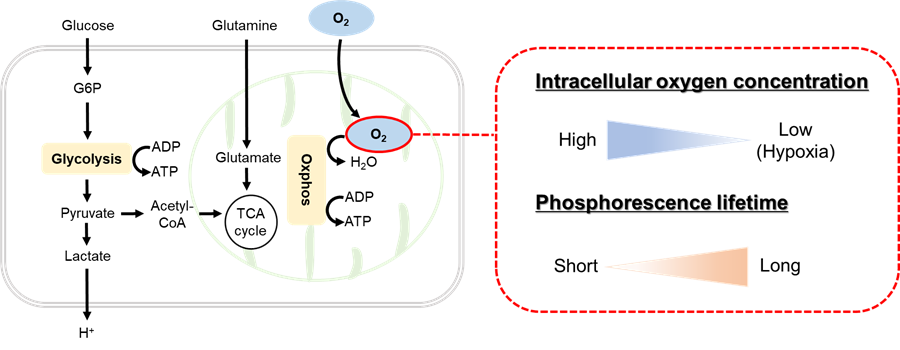 |
| Figure 1. Principle of Intracellular Oxygen Detection Kit |
Kit Contents
| 100 tests | 300 tests | |
| Intracellular Oxygen Probe | ×1 | ×3 |
| Mineral Oil | 10 ml ×1 | 10 ml ×3 |
Storage Conditions
Store at -20 °C
Required Equipment and Materials
- Microplate reader with temperature control and time-resolved fluorescence (TR-F) measurement
- 96-well black clear-bottom microplate
- 20-200 μl multichannel pipette
- 100-1000 μl, 20-200 μl and 2-20 μl micropipettes
- Dimethyl sulfoxide (DMSO)
- 1.5 ml microtube
- Conical tube
- Heating block or water bath
Precautions
- Equilibrate reagents to room temperature prior to use.
- Briefly centrifuge the Intracellular Oxygen Probe tube before opening to remove all content from the walls of the tube and the inside of the cap.
- Analysis of samples in triplicate is recommended for accuracy.
- Set the microplate reader temperature at 37 °C before measurement.
- Pre-warm the Mineral Oil and sample solutions to around 37 °C in a heating block or water bath.
- When using a 96-well microplate, please consider the following.
Suspension cells (e.g., Jurkat cells): >100,000 cells/well
Adherent cells (e.g., HepG2 cells): >50,000 cells/well
Preparation of Solutions
Preparation of Intracellular Oxygen Probe DMSO stock solution
Add 12 μl DMSO to the Intracellular Oxygen Probe tube and dissolve by pipetting.
- The Intracellular Oxygen Probe DMSO stock solution is stable for 2 months when stored at -20 °C and protected from light.
Preparation of a working solution
- Add medium to a conical tube (see Table 1).
- Add DMSO stock solution to the medium.
- The working solution is light-sensitive and cannot be stored after preparation. Prepare the solution just before use and protect it from light by covering it with aluminum foil.
Table 1. The required amount of working solution by sample number
| 24 wells | 48 wells | 96 wells | |
| DMSO stock solution | 3 µl | 5.5 µl | 11 µl |
| Medium | 2997 µl | 5494.5 µl | 10989 µl |
General Protocol
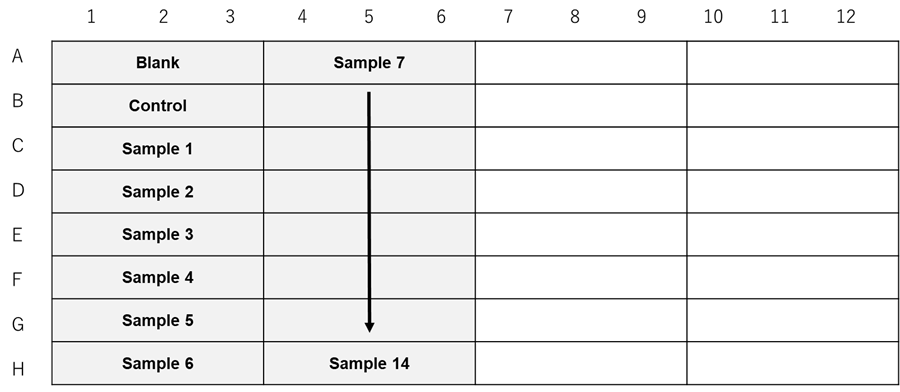
〈Suspension cells〉
When testing sample types or concentrations for the same cell line and the number of cells.
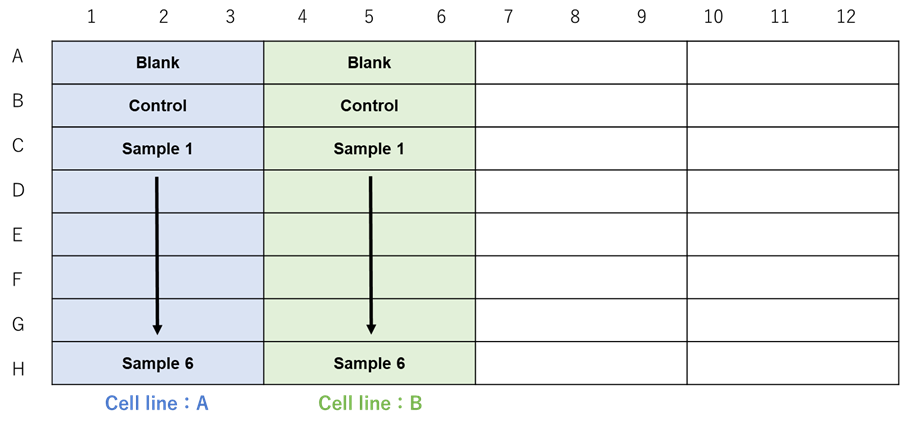
When testing different cell lines.
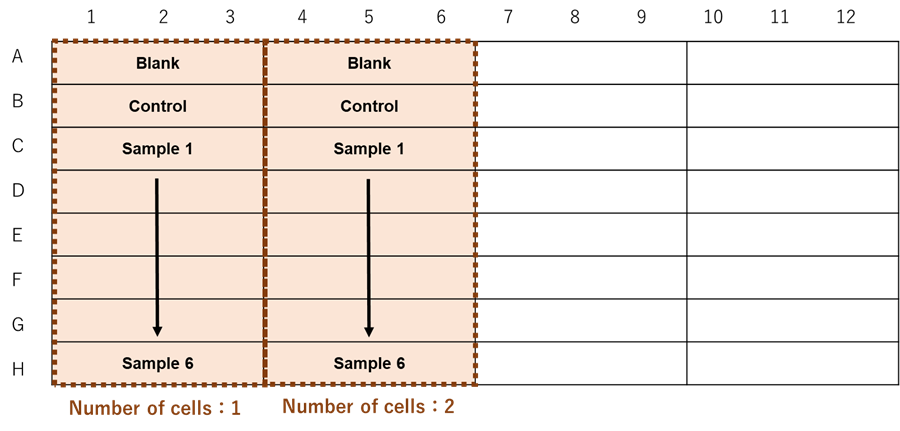
When testing different number of cells.
 |
|
Figure 2. Example assay plate formats (n=3) |
- Suspend cells (>1.0×10⁶ cells/ml) in a working solution in a conical tube.
- Transfer the cell suspension (1) to a culture vessel and culture in an incubator (37 °C, 5% CO2) for 1 h to stain the cells.
- Collect the cell suspension (2) in a conical tube, centrifuge, and remove the supernatant.
- Add medium, suspend sufficiently, centrifuge again, and remove the supernatant.
- Prepare suspensions of unstained cells in medium (>1.0 x 10⁶ cells/ml) as a Blank and stained cells (>1.0 x 10⁶ cells/ml) as the Control and Samples (see Table 2).
- Seed the prepared suspensions (5) (100 μl of each) in a 96-well black clear-bottom microplate (>1.0 x 10⁵ cells/well) (see Table 2 and Figure 2).
- Triplicate measurements are recommended to obtain accurate data.
Blank Control Sample Unstained cells 100 µl - - Stained cells - 100 µl 100 µl Sample solution - - 10 µl Medium 10 µl 10 µl - Mineral Oil 1 drop 1 drop 1 drop - Incubate the microplate for 10 min in a microplate reader (37 °C).
- Pre-warm the microplate reader to 37 °C.
- Incubate in the microplate reader, not an incubator.
- Measure the intensities before the addition of the sample solution in kinetics mode (10-min interval for 20 min) using the microplate reader set to measure in the following two conditions per well:
1st condition ・Mode: Fluorescence, Bottom reading ・Wavelength: Ex: 480 nm, Em: 590 nm ・Temperature: 37 °C ・Integration Time: 20 µs ・Lag Time: 10 µs 2nd condition ・Mode: Fluorescence, Bottom reading ・Wavelength: Ex: 480 nm, Em: 590 nm ・Temperature: 37 °C ・Integration Time: 20 µs ・Lag Time: 40 µs - Take the microplate out of the microplate reader and add 10 µl of medium to Blank and Control wells (see Table 2).
- Pre-warm the medium to around 37 °C in a heating block or water bath.
- Dilute a sample with medium and add 10 µl to the Sample wells (see Table 2).
- Pre-warm the diluted sample solution to around 37 °C in a heating block or water bath.
- Immediately after adding the sample solution, add 1 drop of Mineral Oil to all wells.
- Pre-warm the Mineral Oil to around 37 °C in a heating block or water bath.
- Incubate the microplate for 10 min in a microplate reader (37 °C).
- Pre-warm the microplate reader to 37 °C.
- Incubate in the microplate reader, not an incubator.
- Measure the intensities after the addition of sample solution in kinetics mode (10-min interval for 200 min) using the microplate reader set to measure in the following two conditions per well:
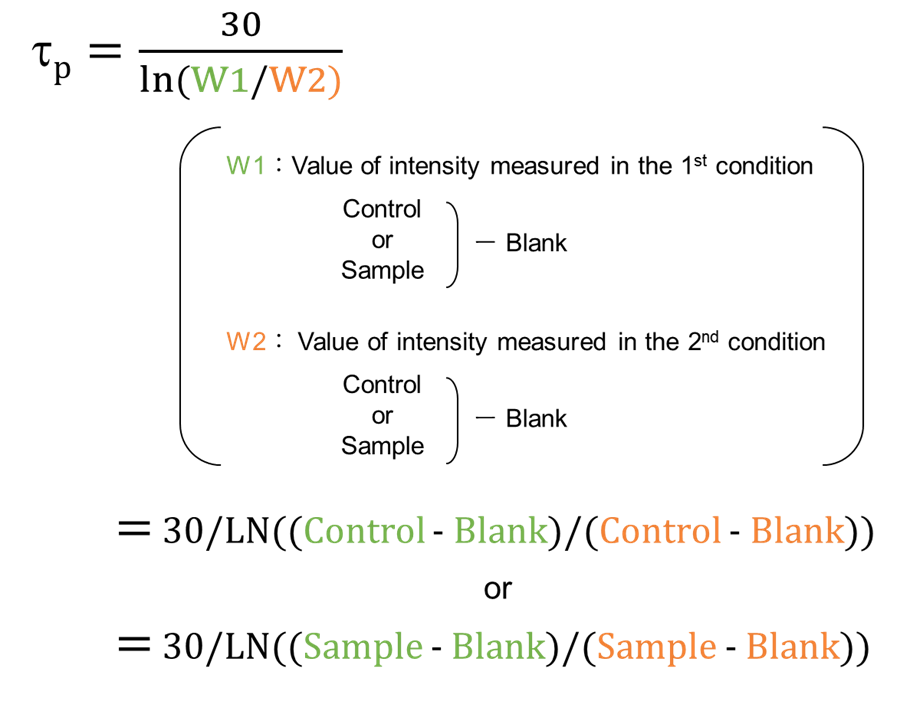
1st condition ・Mode: Fluorescence, Bottom reading ・Wavelength: Ex: 480 nm, Em: 590 nm ・Temperature: 37 °C ・Integration Time: 20 µs ・Lag Time: 10 µs 2nd condition ・Mode: Fluorescence, Bottom reading ・Wavelength: Ex: 480 nm, Em: 590 nm ・Temperature: 37 °C ・Integration Time: 20 µs ・Lag Time: 40 µs - Calculate the phosphorescence lifetime (tp) using the following equation from the intensity values measured in the two conditions, and plot a graph with horizontal axis time (min) and vertical axis phosphorescence lifetime (µs).
〈Adherent cells〉
When testing sample types or concentrations for the same cell line and the number of cells.
When testing different cell lines.
When testing different number of cells.
|
|
Figure 3. Example assay plate formats (n=3) |
- Seed cell suspension (100 µl, >5.0×10⁵ cells/ml) in a 96-well black clear-bottom microplate for the Blank, Control, and Samples.
- Triplicate measurements are recommended to obtain accurate data.
- Culture overnight in an incubator (37 °C, 5% CO2).
- Remove the medium from the Control and Samples and add 100 µl of working solution.
- Culture in an incubator (37 °C, 5% CO2) for 1 h to stain the cells.
- Remove the solution (Blank: medium; Control and Samples: working solution) and add 100 µl of the medium.
- Remove the medium and add 100 µl of medium.
- Incubate the microplate for 10 min in a microplate reader (37 °C).
- Pre-warm the microplate reader to 37 °C.
- Incubate in the microplate reader, not an incubator.
- Measure the intensities before the addition of sample solution in kinetics mode (10-min interval for 20 min) using the microplate reader set to measure in the following two conditions per well:
1st condition ・Mode: Fluorescence, Bottom reading ・Wavelength: Ex: 480 nm, Em: 590 nm ・Temperature: 37 °C ・Integration Time: 20 µs ・Lag Time: 10 µs 2nd condition ・Mode: Fluorescence, Bottom reading ・Wavelength: Ex: 480 nm, Em: 590 nm ・Temperature: 37 °C ・Integration Time: 20 µs ・Lag Time: 40 µs - Take the microplate out of the microplate reader and add 10 µl of medium to Blank and Control wells (see Table 3).
- Pre-warm the medium to around 37 °C in a heating block or water bath.
Blank Control Sample Medium 110 µl 110 µl 100 µl Sample solution - - 10 µl Mineral Oil 1 drop 1 drop 1 drop - Dilute a sample with medium and add 10 µl to the Sample wells (see Table 3).
- Pre-warm the diluted sample solution to around 37 °C in a heating block or water bath.
- Immediately after adding the sample solution, add 1 drop of Mineral Oil to all wells.
- Pre-warm the Mineral Oil to around 37 °C in a heating block or water bath.
- Incubate the microplate for 10 min in a microplate reader (37 °C).
- Pre-warm the microplate reader to 37 °C.
- Incubate in the microplate reader, not an incubator.
- Measure the intensities after the addition of sample solution in kinetics mode (10-min interval for 200 min) using the microplate reader set to measure in the following two conditions per well;
1st condition ・Mode: Fluorescence, Bottom reading ・Wavelength: Ex: 480 nm, Em: 590 nm ・Temperature: 37 °C ・Integration Time: 20 µs ・Lag Time: 10 µs 2nd condition ・Mode: Fluorescence, Bottom reading ・Wavelength: Ex: 480 nm, Em: 590 nm ・Temperature: 37 °C ・Integration Time: 20 µs ・Lag Time: 40 µs - Calculate the phosphorescence lifetime (tp) using the following equation from the intensity values measured in the two conditions, and plot a graph with horizontal axis time (min) and vertical axis phosphorescence lifetime (µs).
Experimental Example
Changes in intracellular oxygen concentration (measured as phosphorescence lifetime) in HepG2 cells on treatment with the mitochondrial uncoupler FCCP (plate reader detection).
- HepG2 cells (7.2 x 10⁵ cells/ml) were seeded (100 µl, 7.2 x 10⁴ cells/well) in a 96-well black clear-bottom microplate.
- The cells were cultured overnight in an incubator (37 °C, 5% CO2).
- The medium (DMEM containing 10% fetal bovine serum and 1% penicillin-streptomycin) was removed from the Control and Sample wells.
- A working solution (100 µl/well) was added to the Control and Sample wells of the 96-well black clear-bottom microplate.
- The microplate was incubated for 1 h in an incubator (37 °C, 5% CO2).
- The solution (Blank: medium; Control and Samples: working solution) was removed from the wells, and the medium (DMEM containing 10% FBS and 1% P/S) was added (100 µl/well).
- The medium was removed from the wells, and the medium (DMEM containing 10% FBS and 1% P/S) was added (100 µl/well).
- The microplate was incubated at 37 °C for 10 min in the microplate reader.
- Kinetics were measured using the microplate reader (Ex: 480 nm, Em: 590 nm, 10-min interval for 20 min, Bottom reading, two condotions).
- The following additions were made: Blank and Control wells: medium (DMEM containing 10% FBS and 1% P/S) (10 μl/well); Sample 1: FCCP diluted in medium (DMEM containing 10% FBS and 1% P/S) (10 μl/well); Sample 2: Antimycin diluted in medium (DMEM containing 10% FBS and 1% P/S) (10 μl/well).
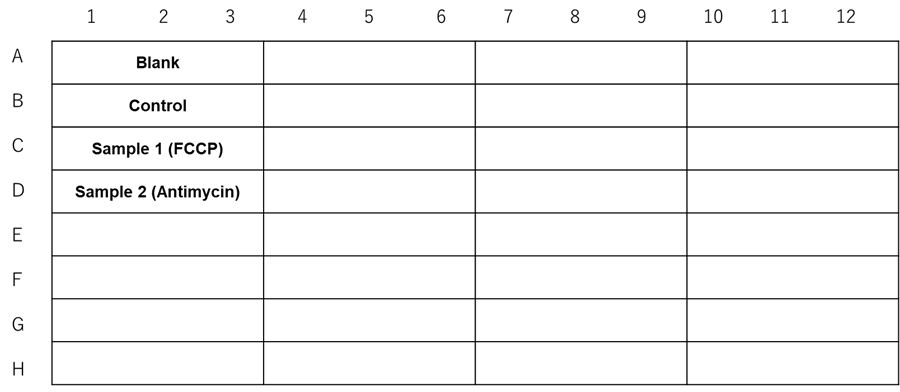
Figure 4. Experimental example assay plate formats (n=3)
- Mineral Oil (1 drop) was added to all wells.
- The microplate was incubated at 37 °C for 10 min in the microplate reader.
- Kinetics were measured using the microplate reader (Ex: 480 nm, Em: 590 nm, 10-min interval for 200 min, Bottom reading, two conditions).
- Phosphorescence lifetime was calculated from the intensity measurements.
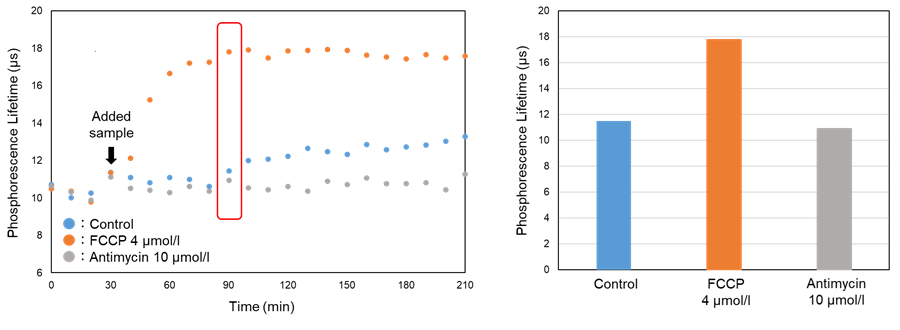
Figure 5. The changes in phosphorescence lifetime treated FCCP (uncoupler)
The phosphorescence lifetime was increased by FCCP treatment compared with control cells.
Changes in intracellular oxygen concentration in HepG2 cells on treatment with the mitochondrial uncoupler FCCP (imaging detection).
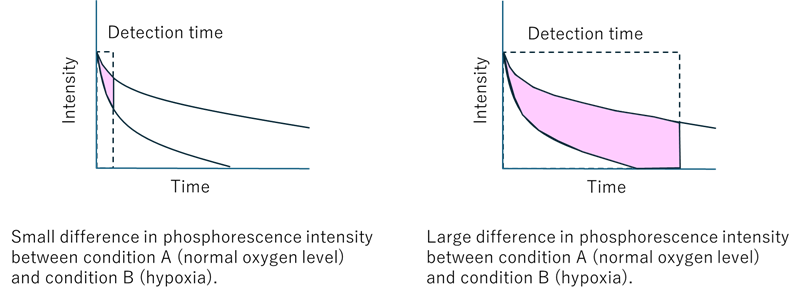
- Since phosphorescence has a longer emission time than fluorescence, the phosphorescence signal cannot be adequately detected if the detection time per pixel is too short. The detection time per pixel must be considered to detect the oxygen responsiveness of phosphorescence using confocal fluorescence microscopy (see Figure 6). Since the optimum detection time is different for each device and detection condition, please perform a preliminary experiment to evaluate the detection time per pixel before this experiment. The following experiments are performed using a ZEISS confocal fluorescence microscope (model: LSM 800).
 |
|
Figure 6. Effect of detection time on oxygen detection using phosphorescence |
- Preliminary Experiment (optimization of scan speed) -
- HepG2 cells (6.0 x 10⁵ cells/ml) were seeded (100 µl, 6.0 x 10⁴ cells/well) in a 3-well glass-base dish (IWAKI, code: 3970-103).
- Using an imaging vessel with well that are round in shape and about the same size as a 96-well plate (see Figure 7). µ-slide 8 well plate (ibidi) with square wells or a 5 cm glass-base dish will not allow the oil to penetrate all the way to the wells.
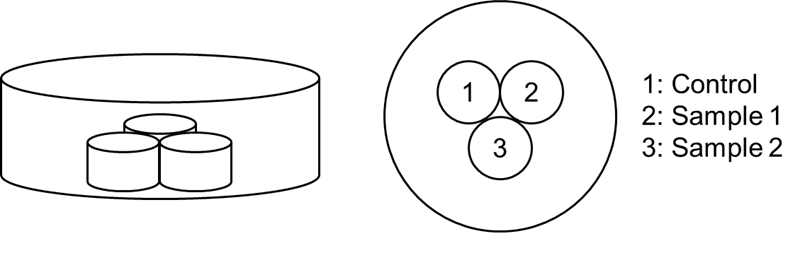
Figure 7. The imaging vessel
- The medium (DMEM containing 10% fetal bovine serum and 1% penicillin-streptomycin) (2 ml) was added to the outside of the wells to prevent drying.
- The cells were cultured overnight in an incubator (37 °C, 5% CO2).
- The medium was removed from the Control and Sample wells.
- A working solution (100 µl/well) was added to the Control and Sample wells of the 3-well glass-base dish.
- The dish was incubated for 1 h in an incubator (37 °C, 5% CO2).
- The solution (Control and Sample: working solution) was removed from the wells, and a medium (DMEM containing 10% FBS and 1% P/S) was added (100 µl/well).
- The medium was removed from the wells, and the medium (DMEM containing 10% FBS and 1% P/S) was added (100 µl/well).
- The dish was incubated at 37 °C for 10 min in the incubator.
- The following additions were made: Control: medium (DMEM containing 10% FBS and 1% P/S) (10 μl/well); Sample 1: FCCP diluted in medium (DMEM containing 10% FBS and 1% P/S) (10 μl/well) (see Figure 7).
- Mineral Oil (1 drop) was added to all wells.
- The dish was incubated at 37 °C for 120 min in the incubator.
- The cells were observed using the confocal fluorescence microscope under multiple scan speed conditions.
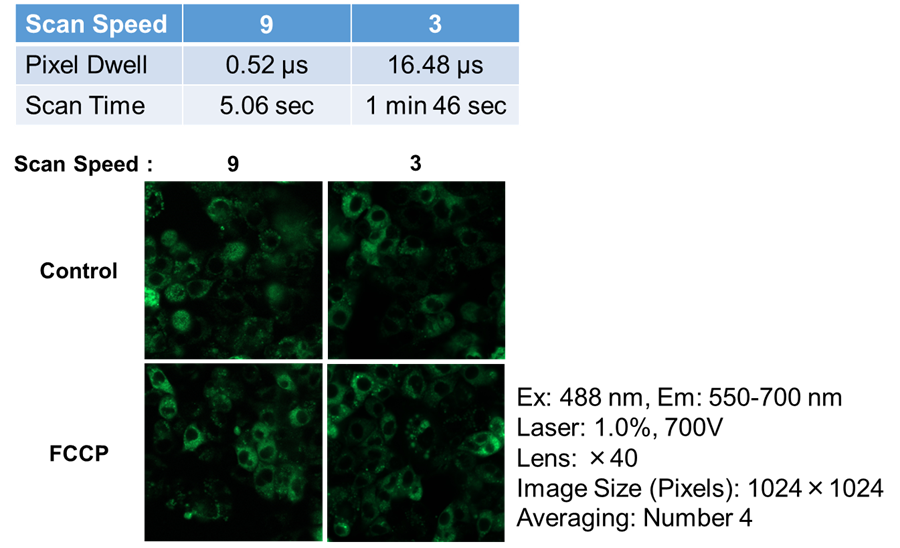
Figure 8. The changes of phosphorescence intensity treated FCCP under multiple scan speed conditions
The preliminary experiment result confirmed the difference between Control and FCCP under Scan Speed: 3 rather than under Scan Speed: 9.
So, this experiment confirmed the time-dependent intensity change by FCCP under Scan Speed: 3.
- Experiment (time-dependent intensity change by FCCP) -
- HepG2 cells (6.0 x 10⁵ cells/ml) were diluted in medium (DMEM containing 10% FBS and 1% P/S) and seeded (100 µl, 6.0 x 10⁴ cells/well) in a 3-well glass-base dish (IWAKI, code: 3970-103).
- The medium (DMEM containing 10% FBS and 1% P/S) (2 ml) was added to the outside of the wells to prevent drying.
- The cells were cultured overnight in an incubator (37 °C, 5% CO2).
- The medium was removed from the Control and Sample wells.
- A working solution (100 µl/well) was added to the Control and Sample wells of the 3-well glass-base dish.
- The dish was incubated for 1 h in an incubator (37 °C, 5% CO2).
- The solution (Control and Sample: working solution) was removed from the wells, and a medium (DMEM containing 10% FBS and 1% P/S) was added (100 µl/well).
- The medium was removed from the wells, and the medium (DMEM containing 10% FBS and 1% P/S) was added (100 µl/well).
- The dish was incubated at 37 °C for 10 min in the incubator.
- The following additions were made: Control: medium (DMEM containing 10% FBS and 1% P/S) (10 μl/well); Sample 1: FCCP diluted in medium (DMEM containing 10% FBS and 1% P/S) (10 μl/well) (see Figure 7).
- Mineral Oil (1 drop) was added to all wells.
- The cells were observed using the confocal fluorescence microscope under scan speed: 3 conditions.
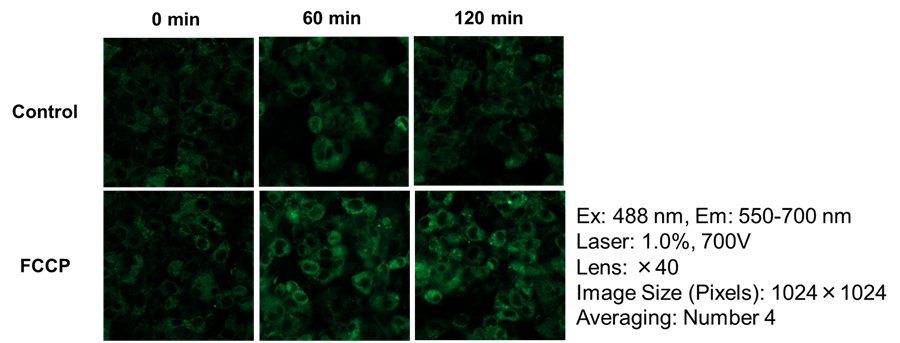
Figure 9. The changes of phosphorescence intensity treated FCCP under Scan Speed: 3
The changes in the intensity of Control and FCCP were confirmed at 60 min and 120 min after FCCP stimulation.
Frequently Asked Questions / Reference


I306: Intracellular Oxygen Detection Kit
Revised Nov., 18, 2024