 Hidden sections will not be printed.
General Information
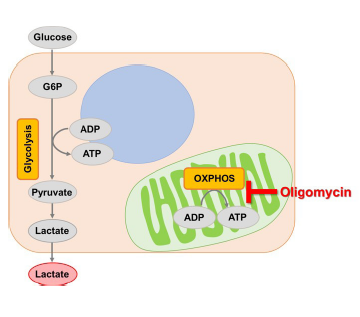
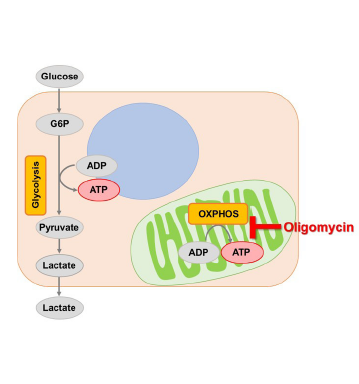
Adenosine triphosphate (ATP), synthesized by glycolysis and mitochondrial oxidative phosphorylation, is a crucial energy source for living cells. Many cancer cells produce ATP by glycolysis. However, recent studies have suggested that if glycolysis is suppressed in cancer cells, their ATP synthesis shifts to oxidative phosphorylation by enhancing mitochondrial function1, 2). It is expected that understanding these phenomena will be helpful for elucidation of the mechanism of anticancer drugs and will lead to the development of therapeutic strategies for cancer, neurodegenerative disease, and various diseases.
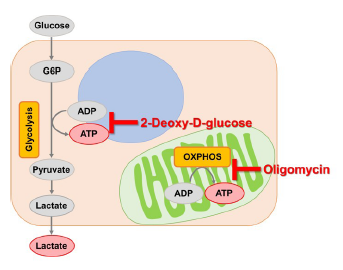
The Glycolysis/OXPHOS Assay Kit enables analysis of cellular glycolytic capacity, whether cells rely on glycolysis or oxidative phosphorylation for energy production, and metabolism shift by using inhibitors (Oligomycin and/or 2-DG).
The kit includes all the reagents required for these evaluations.
Kit Contents
| Dye Mixture (Blue cap) | ×1 | Use for Lactate Assay |
| Lactate Standard (10 mmol/l) (Blue cap) | 150 μl×1 | |
| LDH Solution (Purple cap) | 12 μl×1 | |
| Lactate Assay Buffer | 5.5 ml×1 | |
| Reconstitution Buffer (White cap) | 550 μl×1 | |
| Substrate (Green cap) | ×1 | Use for ATP Assay |
| Luciferase Solution (Green cap) | 10 μl×1 | |
| ATP Assay Buffer | 5.5 ml×1 | |
| Oligomycin (Yellow cap) | ×1 | Use as an inhibitor |
| 2-DG (Red cap) | 140 μl×1 |
- This kit includes the reagents corresponding to 48 wells of a 96-well microplate. The number of samples that can be evaluatedwith this kit is posted on the product web page.
- Evaluation with this kit is performed by relative evaluation using absorbance and/or luminescence values.
Storage Conditions
Store at 0-5 °C
Required Equipment and Materials
- Microplate reader (450 nm filter and luminescence)
- 96-well microplate
- 96-well white microplate
- If ATP levels in adherent cells are measured, select a cell culture plate.
- If microscopic observation of cells or bottom reading measurement of a microplate is required, use a white plate with clear-bottom.
- Refer to the Q&A for tested white plates.
- Incubator (37 °C)
- 20-200 μl multichannel pipette
- 100-1000 μl, 20-200 μl, 2-20 μl micropipettes
- Dimethyl sulfoxide (DMSO)
- Conical tube
Precautions
- Equilibrate reagents to room temperature prior to use.
- Briefly centrifuge the tubes containing Lactate Standard (blue cap), LDH Solution (purple cap), Reconstitution Buffer (white cap), Luciferase Solution (green cap) and 2-DG (red cap) before opening to remove all content from the walls of the tube and inside the cap.
- Pipette the LDH Solution (used for Lactate Assay) before use to ensure the enzyme is homogenous.
- Analysis of samples in triplicate is recommended for accuracy.
- Since the enzymatic reaction starts immediately after adding Lactate working solution to a wall, use a multichannel pipette to minimize the experimental error from time lag in pipetting.
- Dye Mixture and Substrate are stored in a glass bottle with an aluminum cap. Handle with caution, wear gloves.
Preparation of Solution (inhibitor)
Preparation of Oligomycin stock solution (10 mmol/l)
Add 10 μl DMSO to the Oligomycin tube (yellow cap) and dissolve by pipetting.
- It is difficult to see the Oligomycin reagent. After adding DMSO, repeat pipetting several times and mix well.
- The Oligomycin stock solution is stable for 2 months when stored -20 °C.
Preparation of Solutions and Measurement (Lactate Assay)
Preparation of Dye Mixture stock solution
Add all Reconstitution Buffer (white cap) to a Dye Mixture vial. Close the cap and dissolve the contents completely.
- Transfer the Dye Mixture stock solution to the vial of the Reconstitution Buffer and store it at 0-5 °C with protection from light.
Dye Mixture stock solution is stable for 4 months under these conditions.
Preparation of Lactate working solution
- Add Dye Mixture stock solution to a conical tube and dilute it with Lactate Assay Buffer.
- Add LDH Solution (purple cap) to the solution prepared in step 1.
- Refer to Table 1.
- Lactate working solution is light sensitive. Prepare the solution just before use and protect it from light by covering it with aluminum foil. Please use up Lactate working solution within that day.
Table 1. Examples of Lactate working solution preparation
| for 24 well | for 48 well | |
| Dye Mixture stock solution | 250 μl | 500 μl |
| Lactate Assay Buffer | 2.25 ml | 4.5 ml |
| LDH Solution (Purple cap) | 5 μl | 10 μl |
Sample preparation
Prepare cell culture supernatant sample.
- Please prepare samples diluted with double-deionized H2O (ddH2O) so that the absorbance is lower than that of 1 mmol/l Lactate standard solution (see Figure 1).
- In case a medium contains serum, read the blank absorbance (serum containing medium) as background control and subtract its value from the absorbance of each sample.
- Required sample amount is 20 μl for each well.
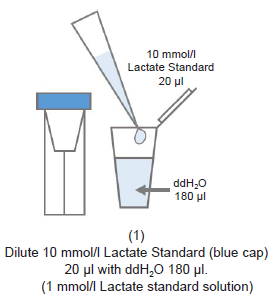
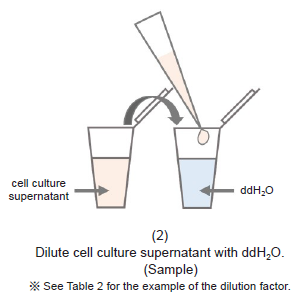
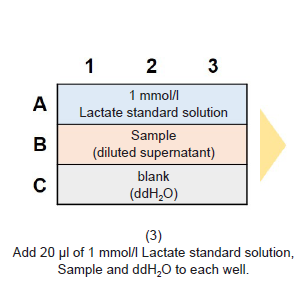
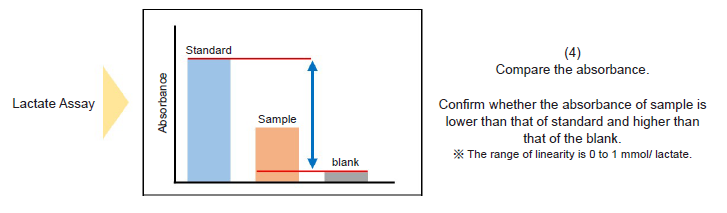
Figure 1. Method for dilution of samples for Lactate Assay
| Inhibitor treatment time | ||||
| 3 hours | 5 hours | 24 hours | ||
| 24-well | HeLa, HepG2, A549 (5×10⁴ cells/well) | 10-fold | 10-fold | 20-fold |
| WI-38 (5×10⁴ cells/well) | 10-fold | 10-fold | 15-fold | |
| Jurkat (1×10⁵ cells/well) | 10-fold | 10-fold | 15-fold | |
| 96-well | HeLa, HepG2, A549 (5×10³ cells/well) | 10-fold | 15-fold | |
| WI-38 (5×10³ cells/well) | 10-fold | 10-fold | ||
| Jurkat (1×10⁴ cells/well) | 10-fold | 10-fold | ||
Measurement
.png)
- Add 20 μl of sample solutions to each well.
- To obtain accurate data, triplicate measurements are recommended.
- Add 80 μl of Lactate working solution to each well.
- Because the enzymatic reaction starts immediately after the Lactate working solution is added, use a multichannel pipette to minimize time lags in pipetting.
- Incubate the microplate at 37 °C for 30 minutes.
- Seal the microplate during incubation to prevent evaporation.
- Measure the absorbance at 450 nm with a microplate reader.
Preparation of Solutions and Measurement (ATP Assay)
Preparation of ATP working solution
- Add 1 ml of ATP Assay Buffer to the Substrate vial.
- Substrate vial is capped under vacuum pressure. Please open it carefully. Do not open quickly to avoid spilling contents.
- Close the cap of the Substrate and dissolve the contents completely and transfer it to the ATP Assay Buffer bottle.
- Add 10 μl of Luciferase Solution (green cap) to the solution prepared in step (2).
- Mix by gently inverting the contents to obtain ATP working solution.
- The ATP working solution is stable for 1 month when stored at -20 °C.
Measurement
.png)
- The above incubation is necessary to efficiently extract ATP from cells and for a stable luminescent signal.
- Prepare the cells in 96-well white microplate.
- To obtain accurate data, triplicate measurements are recommended.
- Add 100 μl of ATP working solution to each well.
- Mix the contents by using the process of reverse pipetting to avoid air bubbles that could influence the luminescent signal.
- After adding the ATP working solution, mix the contents for 2 minutes on an orbital shaker or similar.
- Please protect the plate from light by covering it with aluminum foil because the luminescent signal is light sensitive.
- Incubate the microplate at 25 °C for 10 minutes in a microplate reader.
- Please incubate the microplate in an incubator which has been temperature-settled at 25 °C or at a room temperature around 25 °C.
- Measure luminescence with a microplate reader.
General Protocol① (Analysis of Cellular Glycolytic Capacity)
Overview of Analysis
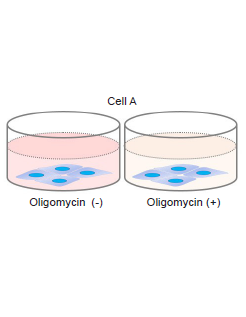
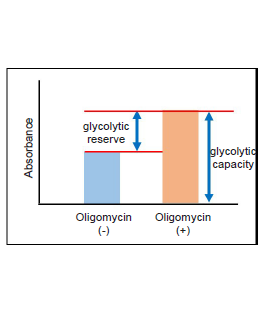
The purpose of this evaluation is to know the enhanced level of glycolysis in the cells using lactate production.To confirm the cellular glycolytic capacity, inhibit ATP synthesis by oxidative phosphorylation with a treatment using Oligomycin.
Reagents
| Dye Mixture (Blue cap) | ×1 | Use for Lactate Assay |
| Lactate Standard (10 mmol/l) (Blue cap) | 150 μl×1 | |
| LDH Solution (Purple cap) | 12 μl×1 | |
| Lactate Assay Buffer | 5.5 ml×1 | |
| Reconstitution Buffer (White cap) | 550 μl×1 | |
| Oligomycin (Yellow cap) | ×1 | Use as an inhibitor |
Preparation of Oligomycin solution
- Dilute the 10 mmol/l Oligomycin stock solution 1,000-fold with culture medium (to give 10 μmol/l Oligomycin solution).
- For example, to prepare 1 ml of Oligomycin solution, mix 1 μl of 10 mmol/l Oligomycin stock solution and 1 ml of culture medium.
- Dilute the solution prepared in step (1) 8-fold with culture medium to give 1.25 μmol/l Oligomycin solution.
- Where cells are to be stimulated with a drug, add the drug to the medium used to prepare the Oligomycin solution so that the drug concentration is the same as required for stimulation (see Figure 2).
- Use Oligomycin solution within the same day (it cannot be stored).
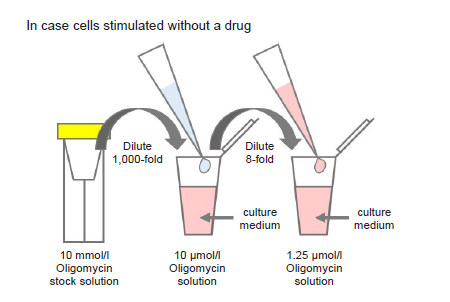
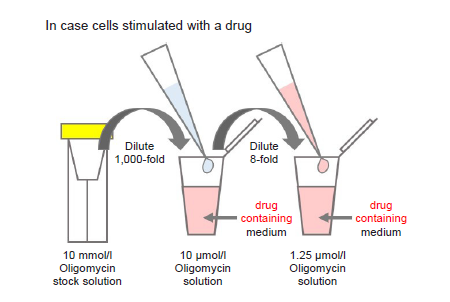
Figure 2. Preparation of Oligomycin-containing medium
Experimental Procedure
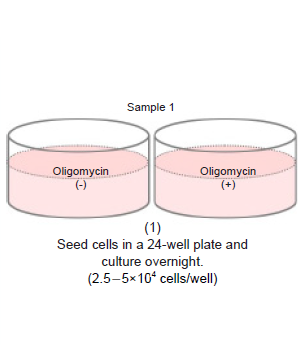
- Seed cells in a 24-well plate (2.5-5×10⁴ cells/well) and culture overnight in an incubator (37 °C, 5% CO2).
- Wells with and without Oligomycin treatment are required for each sample.
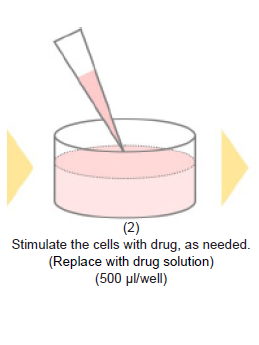
- Remove the medium and stimulate the cells with the drug, as needed.
- Add drug solution to wells.
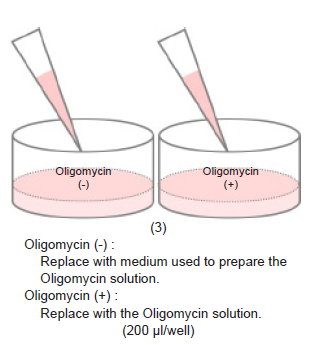
- Remove the medium and add 200 μl of 1.25 μmol/l Oligomycin solution to test sample Oligomycin (+) wells.
- Add 200 μl of the medium used to prepare the Oligomycin solution to test sample Oligomycin (-) wells.
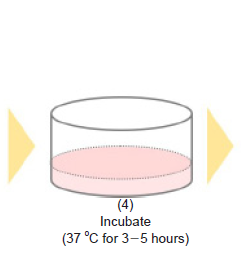
- Incubate the microplate for 3-5 hours in an incubator (37 °C, 5% CO2).
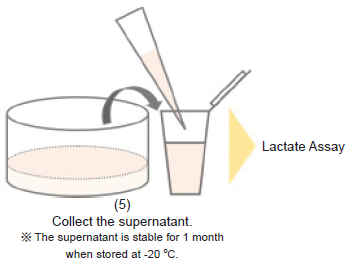
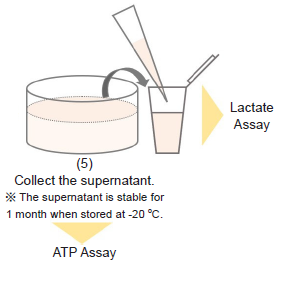
- Collect 100 μl of each cell culture supernatant into a 1.5 ml microtube and perform the Lactate Assay.
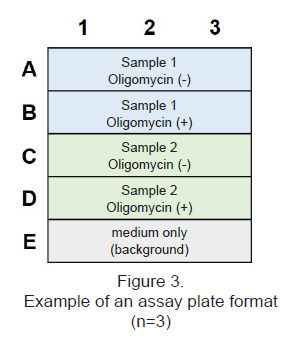
- See Figure 3 for an assay plate format when performing the Lactate Assay.
- Compare the absorbance values of with and without Oligomycin treatment.
Experimental Example : Change in glycolytic capacity of glycolytic inhibitor-treated HeLa cells
- HeLa cells were seeded in four wells of a 24-well plate (2.5×10⁴ cells/well in MEM containing 10% fetal bovine serum and 1% penicillin-streptomycin) and cultured overnight in an incubator (37 °C, 5% CO2).
- Two wells were prepared for glycolytic inhibitor stimulation and two wells for the control treatment.
- The medium was removed, and glycolytic inhibitor solution (500 μl, in MEM containing 10% FBS) was added to two cell-seeded wells of the 24-well plate, and MEM containing 10% FBS (500 μl) was added to the other two cell-seeded wells.
- The cells were cultured overnight in an incubator (37 °C, 5% CO2).
- The medium was removed, and 1.25 μmol/l Oligomycin solution (200 μl) was added to the Oligomycin (+) wells.
- The medium (200 μl) used to prepare the Oligomycin solution was added to the Oligomycin (-) wells.
- The cells were cultured for 3 hours in an incubator (37 °C, 5% CO2).
- After incubation, 100 μl of each cell culture supernatant was transferred to a 1.5 ml microtube and diluted 10-fold with ddH2O to prepare sample solutions.
- For background control, MEM only was also diluted 10-fold with ddH2O.
- The sample solutions (20 μl each) were added to individual wells of a 96-well microplate.
- Lactate working solution (80 μl) was added to each well.
- The assay plate was incubated at 37 oC for 30 minutes.
- The absorbance at 450 nm was measured using a microplate reader, and the absorbance values of with and without Oligomycin treatments were compared.
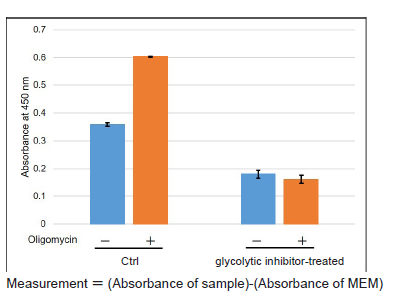
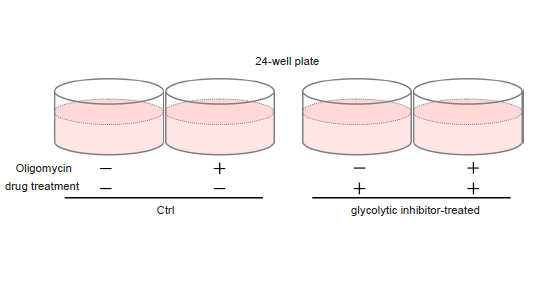
Figure 4. Comparison of glycolytic capacity of glycolytic inhibitor-treated and non-treated (Ctrl) HeLa cells
In case HeLa cells are treated with Oligomycin to inhibit ATP synthesis by oxidative phosphorylation, glycolytic inhibitor non-treated (Ctrl) cells can enhance glycolysis, but glycolytic inhibitor-treated cells cannot enhance glycolysis (decreased glycolytic capacity).
General Protocol② (Analysis of Metabolism Shift)
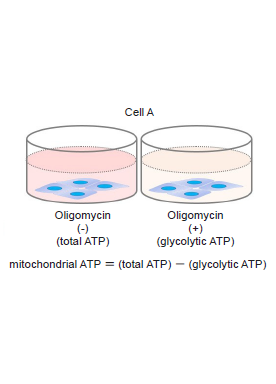
Overview of Analysis
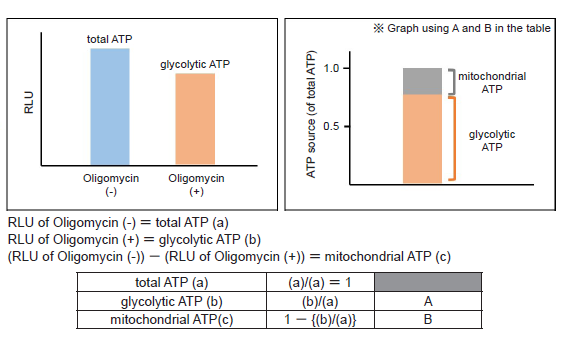
The values can be obtained with this evaluation allows you to know whether cells show a metabolic shift. The amounts of ATP produced by glycolysis and mitochondrial oxidative phosphorylation are determined from the amounts of ATP when the cells were treated with and without Oligomycin (which inhibits ATP synthesis in oxidative phosphorylation).
Reagents
| Substrate (Green cap) | ×1 | Use for ATP Assay |
| Luciferase Solution (Green cap) | 10 μl×1 | |
| ATP Assay Buffer | 5.5 ml×1 | |
| Oligomycin (Yellow cap) | ×1 | Use as an inhibitor |
Preparation of Oligomycin solution
- Dilute the 10 mmol/l Oligomycin stock solution 1,000-fold with culture medium (to give 10 μmol/l Oligomycin solution).
- For example, to prepare 1 ml of Oligomycin solution, mix 1 μl of 10 mmol/l Oligomycin stock solution and 1 ml of culture medium.
- Dilute the solution prepared in step (1) 4-fold with culture medium to give 2.5 μmol/l Oligomycin solution.
- Dilute the solution prepared in step (2) 2-fold with culture medium to give 1.25 μmol/l Oligomycin solution.
- Where cells are to be stimulated with a drug, add the drug to the medium used to prepare the Oligomycin solution so that the drug concentration is the same as required for stimulation (see Figure 5).
- Perform a preliminary experiment and determine whether to use 2.5 or 1.25 μmol/l Oligomycin solution in the experiment (see Experimental Procedure-Preliminary Experiment (optimization of cell number and Oligomycin concentration)).
- Use Oligomycin solution within the same day (it cannot be stored).
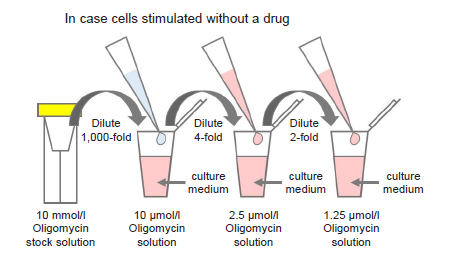
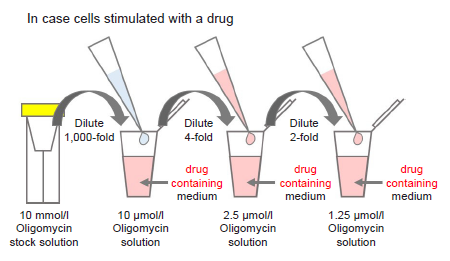
Figure 5. Preparation of Oligomycin-containing medium
Experimental Procedure
-Preliminary Experiment (optimization of cell number and Oligomycin concentration)-
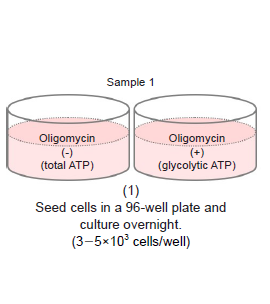
- Seed cells in a 96-well white microplate (3-5×10³ cells/well) and culture in an incubator (37 °C, 5% CO2).
- Adjust the optimal cell number to be seeded according to the drug stimulation time (see Table 5).
- See Figure 6 for an assay plate format when performing the optimization.
- Use the same incubation time as the time required for drug stimulation.
For example, if the drug stimulation time is 24 hours, culture cells overnight after seeding, and then culture for another 24 hours.
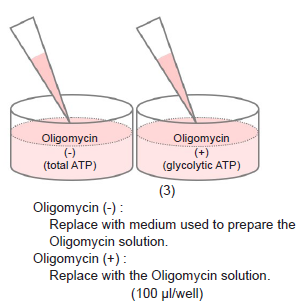
- Remove the medium and add 100 μl of Oligomycin solution to test sample Oligomycin (+) wells.
- Add 100 μl of the medium used to prepare the Oligomycin solution to test sample Oligomycin (-) wells.
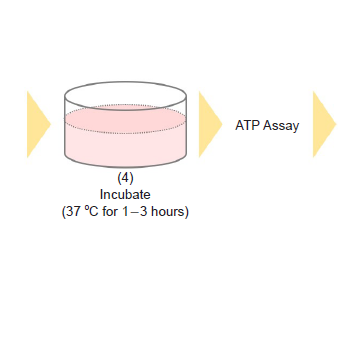
- Incubate the microplate for 1-3 hours in an incubator (37 °C, 5% CO2).
- For incubation time 1-3 hours, the results are almost the same.
- Perform the ATP Assay.
- Compare the luminescence value of with and without Oligomycin treatment.
- Choose the optimum cell number and Oligomycin concentration by referring to Table 6 and Figure 7.
-
Table 5. Example of cell number Drug treatment time without 24 hours HeLa, HepG2, A549 5-10×103 cells 3-5×10³ cells WI-38 5-10×103 cells 5×10³ cells
-
Table 6. Example of Oligomycin concentration Oligomycin treatment time 1 hour 3 hours HepG2, A549, WI-38 1.25 or 2.5 μmol/l 1.25 or 2.5 μmol/l HeLa 2.5 μmol/l 1.25 or 2.5 μmol/l
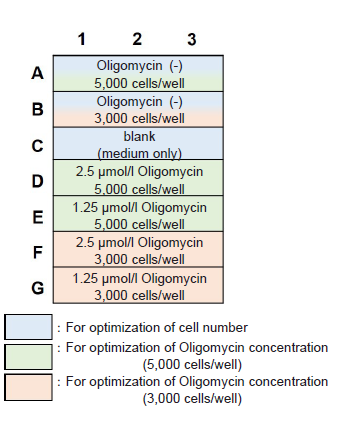
Figure 6. Example of an assay plate format for optimization of cell number and Oligomycin concentration (n=3)
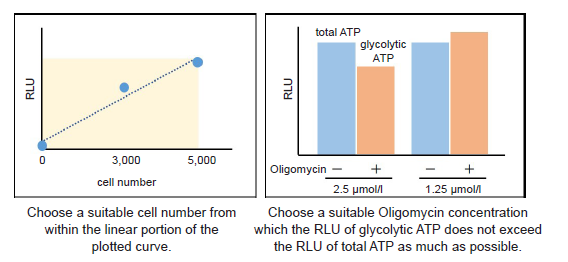
Figure 7. Determination of suitable cell number and Oligomycin concentration
-Experiment-
- Seed cells in a 96-well white microplate (choose a suitable cell number by optimization) and culture overnight in an incubator (37 °C, 5% CO2).
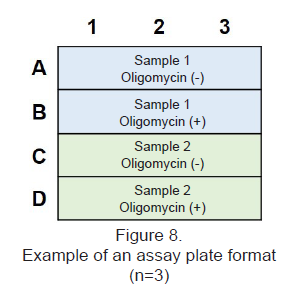
- See Figure 8 for an assay plate format.
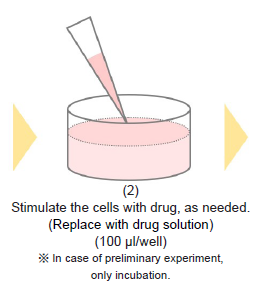
- Remove the medium and stimulate the cells with the drug, as needed.
- Add drug solution to wells.
- Remove the medium and add 100 μl of Oligomycin solution (choose a suitable Oligomycin concentration by optimization) to test sample Oligomycin (+) wells.
- Add 100 μl of the medium used to prepare the Oligomycin solution to test sample Oligomycin (-) wells.
- Incubate the microplate for 1-3 hours in an incubator (37 °C, 5% CO2).
- For incubation time 1-3 hours, the results are almost the same.
- Perform the ATP Assay.
- Compare the luminescence value of with and without Oligomycin treatment.
Experimental Example : Metabolism shift of glycolytic inhibitor-treated HeLa cells
- HeLa cells were seeded in a 96-well white microplate (5×10³ cells/well in MEM containing 10% fetal bovine serum and 1% penicillin-streptomycin) and cultured overnight in an incubator (37 °C, 5% CO2).
- Six wells were prepared for glycolytic inhibitor stimulation and six wells for the control treatment.
- The medium was removed, and glycolytic inhibitor solution (100 μl, in MEM containing 10% FBS) was added to six cell-seeded wells of the 96-well microplate, and MEM containing 10% FBS (100 μl) was added to the other six cell-seeded wells.
- The cells were cultured overnight in an incubator (37 °C, 5% CO2).
- The medium was removed, and 1.25 μmol/l Oligomycin solution (100 μl) was added to the Oligomycin (+) wells.
- The medium (100 μl) used to prepare the Oligomycin solution was added to the Oligomycin (-) wells.
- The cells were cultured for 3 hours in an incubator (37 °C, 5% CO2).
- After incubation, ATP working solution (100 μl) was added to each well.
- The assay plate was orbitally shaken for 2 minutes in a microplate reader.
- The assay plate was incubated at 25 oC for 10 minutes in a microplate reader.
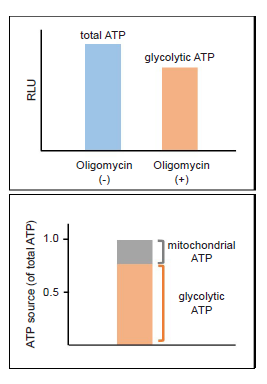
- Luminescence was measured using a plate reader, and total ATP, glycolytic ATP and mitochondrial ATP were calculated.
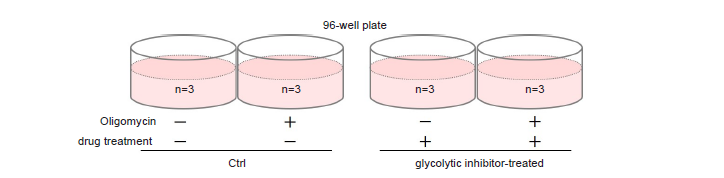
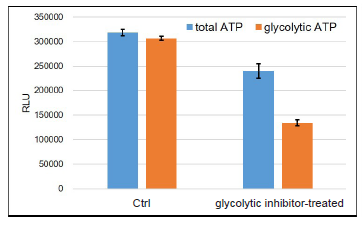
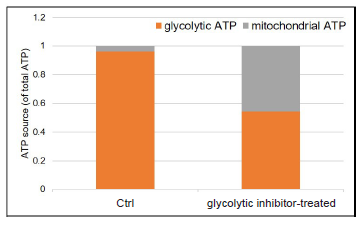
Figure 9. Metabolism shift of glycolytic inhibitor-treated HeLa cells
Glycolytic inhibitor treatment caused a metabolism shift in HeLa cells from glycolysis to oxidative phosphorylation.
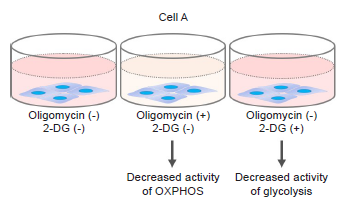
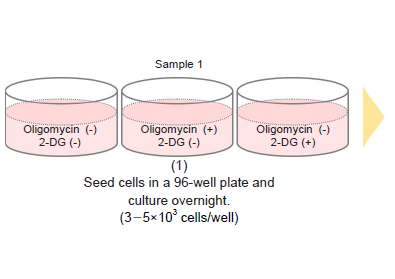
General Protocol③ (Analysis of Metabolic Pathway Dependence)
Overview of Analysis
This is a protocol to know whether the cells are mainly dependent on glycolysis or oxidative phosphorylation by measuring ATP and lactate production. Oligomycin and 2-deoxy-D-glucose (2-DG) inhibits ATP synthesis in oxidative phosphorylation and glycolysis, respectively.
Reagents
| Dye Mixture (Blue cap) | ×1 | Use for Lactate Assay |
| Lactate Standard (10 mmol/l) (Blue cap) | 150 μl×1 | |
| LDH Solution (Purple cap) | 12 μl×1 | |
| Lactate Assay Buffer | 5.5 ml×1 | |
| Reconstitution Buffer (White cap) | 550 μl×1 | |
| Substrate (Green cap) | ×1 | Use for ATP Assay |
| Luciferase Solution (Green cap) | 10 μl×1 | |
| ATP Assay Buffer | 5.5 ml×1 | |
| Oligomycin (Yellow cap) | ×1 | Use as an inhibitor |
| 2-DG (Red cap) | 140 μl×1 |
Preparation of Oligomycin solution
- Dilute the 10 mmol/l Oligomycin stock solution 1,000-fold with culture medium (to give 10 μmol/l Oligomycin solution).
- For example, to prepare 1 ml of Oligomycin solution, mix 1 μl of 10 mmol/l Oligomycin stock solution and 1 ml of culture medium.
- Dilute the solution prepared in step (1) 8-fold with culture medium to give 1.25 μmol/l Oligomycin solution.
- Where cells are to be stimulated with a drug, add the drug to the medium used to prepare the Oligomycin solution so that the drug concentration is the same as required for stimulation (see Figure 10).
- Use Oligomycin solution within the same day (it cannot be stored).
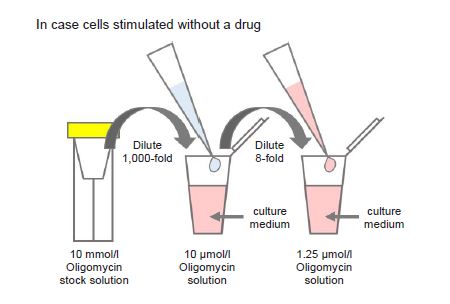
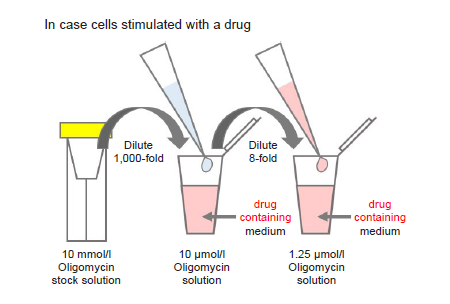
Figure 10. Preparation of Oligomycin-containing medium
Preparation of 2-DG solution
Dilute the 2-DG (red cap) 40-fold with culture medium (to give 22.5 mmol/l 2-DG solution).
-
- For example, to prepare 1 ml of 2-DG solution, mix 25 μl of 2-DG and 975 μl of culture medium.
- ※Where cells are to be stimulated with a drug, add the drug to the medium used to prepare the 2-DG solution so that the drug concentration is the same as required for stimulation (see Figure 11).
- ※Use 2-DG solution within the same day (it cannot be stored).
-
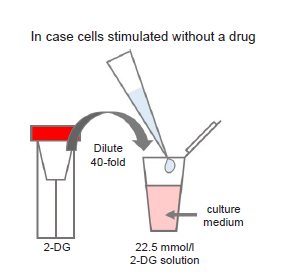
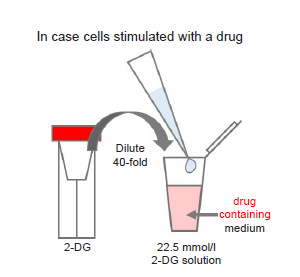
Figure 11. Preparation of 2-DG-containing medium
Experimental Procedure
-Preliminary Experiment (optimization of cell number)-
- Seed cells in a 96-well white microplate (3-5×10³ cells/well) and culture in an incubator (37 °C, 5% CO2).
- Adjust the optimal cell number to be seeded according to the drug stimulation time (see Table 8).
- See Figure 12 for an assay plate format when performing the optimization.
- Use the same incubation time as the time required for drug stimulation.
For example, if the drug stimulation time is 24 hours, culture cells overnight after seeding, and then culture for another 24 hours.
- Remove the medium and add 100 μl of fresh medium.
- Incubate the microplate for 5 hours in an incubator (37 °C, 5% CO2).
- Perform the ATP Assay.
- Compare the luminescence value and choose the suitable cell number (see Figure 13).
-
Table 8. Example of cell number Drug treatment time without 24 hours HeLa, HepG2, A549 5-10×103 cells 3-5×10³ cells WI-38 5-10×103 cells 5×10³ cells
-
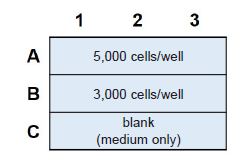
Figure 12. Example of an assay plate format for optimization of cell number (n=3)
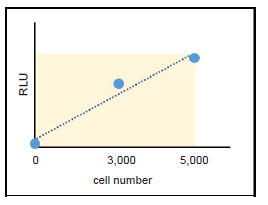
Figure 13. Determination of suitable cell number
Choose a suitable cell number from within the linear portion of the plotted curve.
-Experiment-
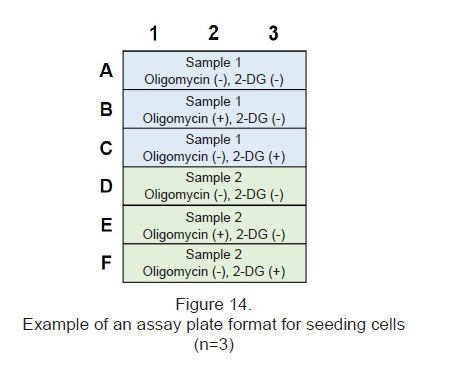
- Seed cells in a 96-well white microplate (choose a suitable cell number by optimization) and culture in an incubator (37 °C, 5% CO2).
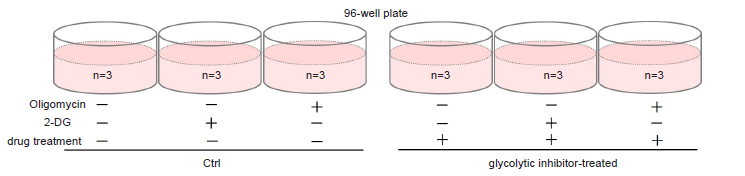
- See Figure 14 for an assay plate format.
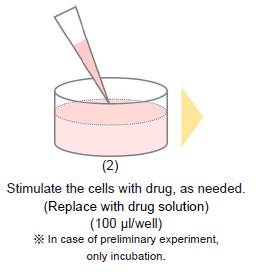
- Remove the medium and stimulate the cells with the drug, as needed.
- Add drug solution to wells.
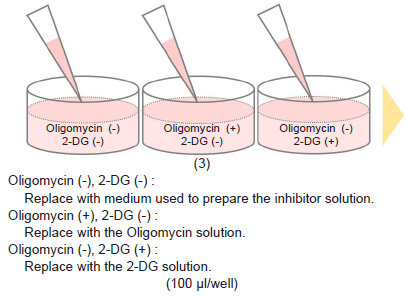
- Remove the medium and add 100 μl of 1.25 μmol/l Oligomycin solution to test sample Oligomycin (+), 2-DG (-) wells.
- Add 100 μl of 2-DG solution to test sample Oligomycin (-), 2-DG (+) wells.
- Add 100 μl of the medium used to prepare the Oligomycin solution and 2-DG solutions to test sample Oligomycin (-), 2-DG (-) wells.
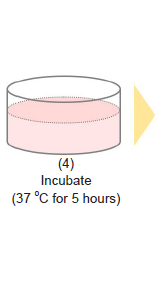
- Incubate the microplate for 5 hours in an incubator (37 °C, 5% CO2).
- Collect 20 μl of each cell culture supernatant into a 1.5 ml microtube and perform the Lactate Assay.
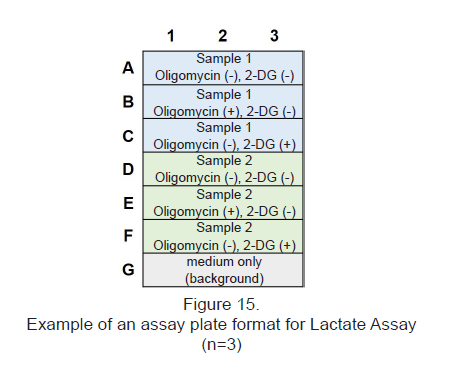
- See Figure 15 for an assay plate format when performing the Lactate Assay.
- Perform the ATP Assay using the cells remaining in the 96-well white microplate.
- Compare the luminescence and absorbance values of with and without Oligomycin and 2-DG treatment, respectively.
Experimental Example : Metabolic pathway dependence of glycolytic inhibitor-treated HeLa cells
- HeLa cells were seeded in a 96-well white microplate (3×10³ cells/well in MEM containing 10% fetal bovine serum and 1% penicillin-streptomycin) and cultured overnight in an incubator (37 °C, 5% CO2).
- Nine wells were prepared for glycolytic inhibitor stimulation and nine wells for the control treatment.
- The medium was removed, and glycolytic inhibitor solution (100 μl, in MEM containing 10% FBS) was added to nine wells of the 96-well microplate, and MEM containing 10% FBS (100 μl) was added to the other nine wells.
- The cells were cultured overnight in an incubator (37 °C, 5% CO2).
- The medium was removed, and 1.25 μmol/l Oligomycin solution (100 μl) was added to Oligomycin (+), 2-DG (-) wells.
- The 22.5 mmol/l 2-DG solution (100 μl) was added to Oligomycin (-), 2-DG (+) wells.
- The medium (100 μl) used to prepare the Oligomycin and 2-DG solutions was added to Oligomycin (-), 2-DG (-) wells.
- The cells were cultured for 5 hours in an incubator (37 °C, 5% CO2).
- After incubation, 20 μl of each cell culture supernatant was transferred to a 1.5 ml microtube and diluted 10-fold with ddH2O to prepare sample solutions for the Lactate Assay.
- For background control, MEM only was also diluted 10-fold with ddH2O.
- ATP working solution (100 μl) was added to the cells remaining in each well of the 96-well white microplate.
- The assay plate was orbitally shaken for 2 minutes in a microplate reader.
- The assay plate was incubated at 25 °C for 10 minutes in a microplate reader.
- Luminescence was measured using a plate reader, and the luminescence values of with and without Oligomycin and 2-DG treatments were compared.
- The sample solutions (20 μl each) prepared in step (8) were added to individual wells of a 96-well microplate.
- Lactate working solution (80 μl) was added to each well.
- The assay plate was incubated at 37°C for 30 minutes.
- The absorbance at 450 nm was measured using a microplate reader, and the absorbance values of with and without Oligomycin and 2-DG treatments were compared.
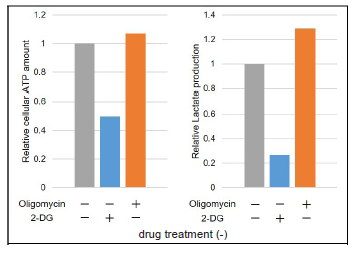
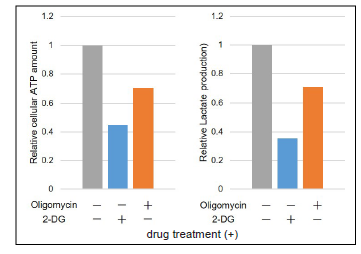
The data were normalized against the level in HeLa cells cultured without Oligomycin and 2-DG.
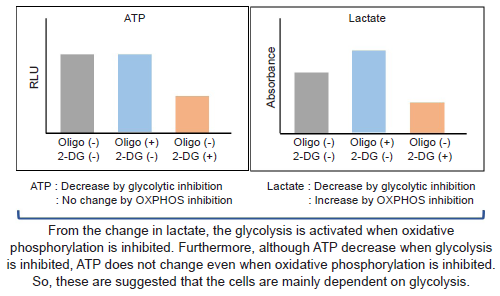
Figure 16. Comparison of metabolic pathway dependence of glycolytic inhibitor-treated and non-treated (Ctrl) HeLa cells
Without glycolytic inhibitor-treatment, the metabolism of HeLa cells is mainly dependent on glycolysis,
but glycolytic inhibitor-treated HeLa cells are dependent on oxidative phosphorylation.
References
1) R. Shiratori, et al., Sci. Rep., 2019, 9, 18699.
2) J. Kim, et al., Cancer Cell, 2019, 35, 191-203.
3) H. Kobayashi, et al., Nature. Chem. Bio., 2021, 17, 335-343.
Frequently Asked Questions / Reference


G270: Glycolysis/OXPHOS Assay Kit
Revised Nov., 15, 2024