Endo-lysosomal pathway
Endo-lysosomal and autophagic dysfunction in Alzheimer’s disease
Endo-lysosomal and autophagy pathways are cellular processes that involve membrane-derived vesicles for recycling of intra- and extracellular components and degradation, respectively. These pathways are getting to be known as critical pathways for senescence-related neurodegenerative disorders like Alzheimer's disease. Recent research1) reveals that autolysosome acidification declines in neurons well before extracellular amyloid deposition. Moreover, endo-lysosomal dysregulations are closely related to late-onset Alzheimer's disease2).
1) Ju-Hyun Lee, et. al., Nat. Neurosci., 25, 688–701 (2022), 2) Zoe P. Van Acker, et. Al., Mol. Neurodegener., 14:20 (2019)
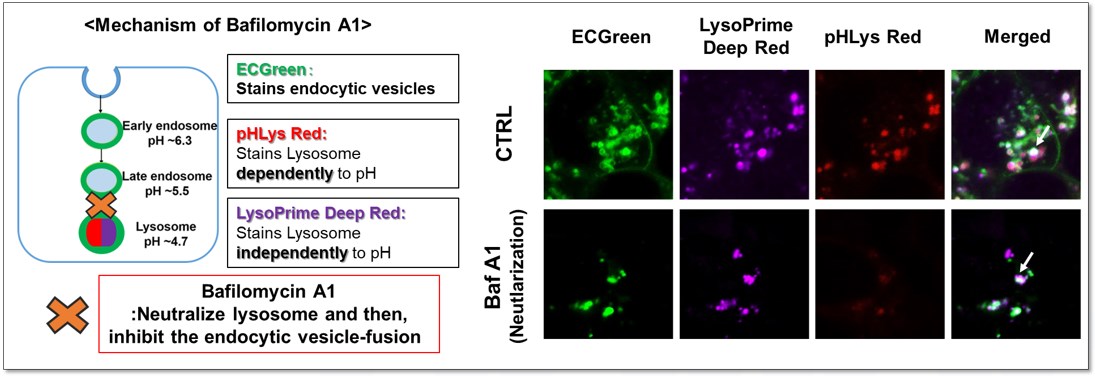
Endocytic vesicles were labeled by ECGreen, and the lysosomal mass and pH were detected separately with LysoPrime Deep Red and pHLys Red. Co-staining with ECGreen and Lysosomal dyes showed the inhibition of endocytic vesicle-fusion induced by Bafilmycin A1.
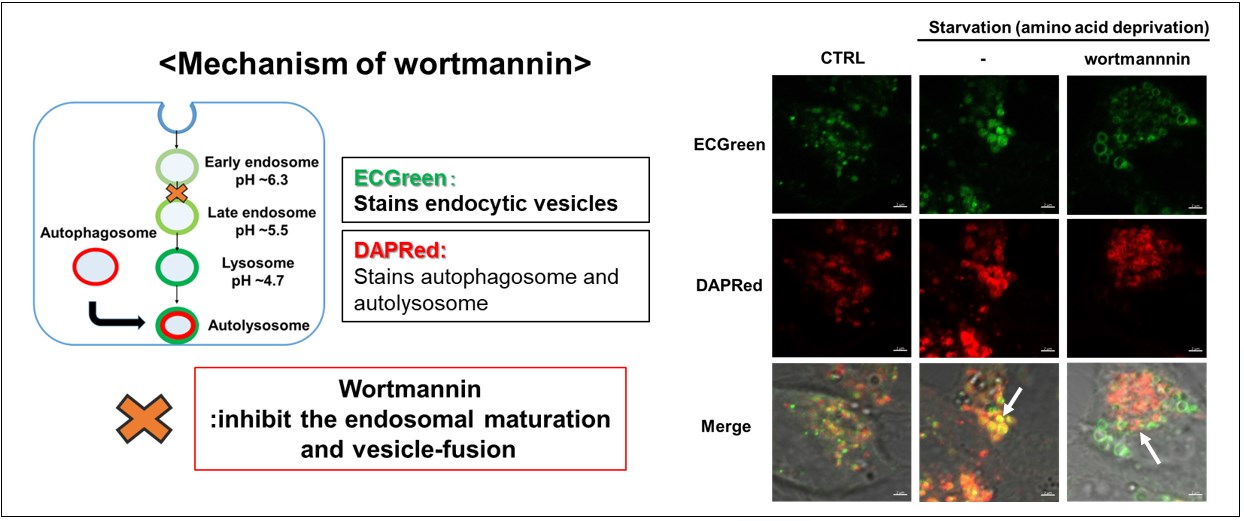
Endocytic and autophagic vesicles were labeled by ECGreen and DAPRed, respectively. Co-staining with ECGreen and DAPRed revealed that starvation-induced autophagic and endocytic vesicle fusion was inhibited by wartmannin.
Back to Top
Autophagy-lysosomal pathway
Tracing autophagosome to autolysosome in live cells
Nampt inhibitor, FK866 inhibits the progress of autophagosome to autolysosome by lysosomal deacidification. A recent finding shows that the dysfunctional condition of nicotinamide adenine dinucleotide (NAD+) biosynthetic enzyme, Nampt induces lysosomal deacidification1). In this section, we tried to determine how NAD+ depletion-induced lysosomal deacidification affects the autophagy-lysosomal pathway.
1) Mikako Yagi, et. al., EMBO J., 40(8), e105268 (2021)
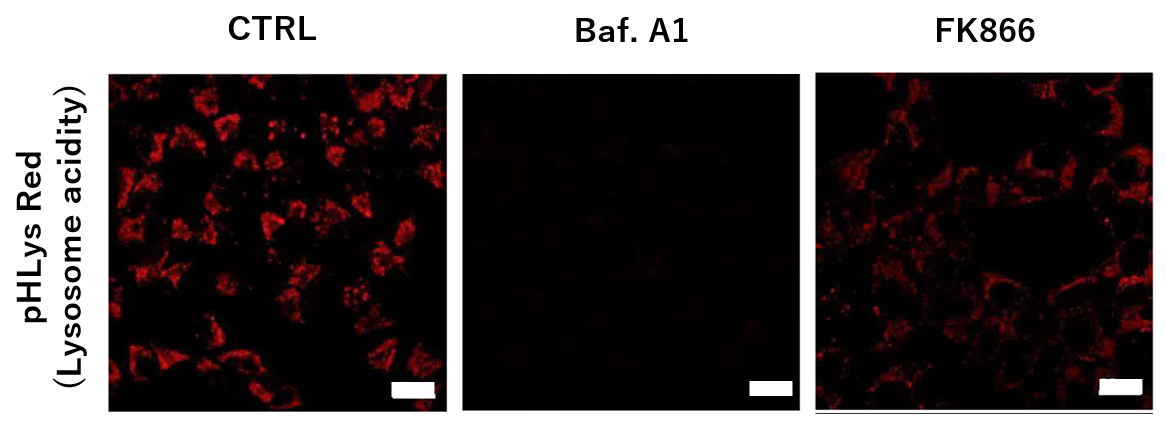

To confirm the effect of the Nampt inhibitor, FK866, on lysosomal acidification, HeLa cells were first labeled by the lysosomal pH detection dye pHLys Red. The cells were then treated with FK866, and lysosomal acidification inhibitor Bafilomycin A1 was used as a positive control. FK866 and Bafilomycin A1-treatment each decreased the fluorescent pHLys Red signal, indicating lysosome neutralization.
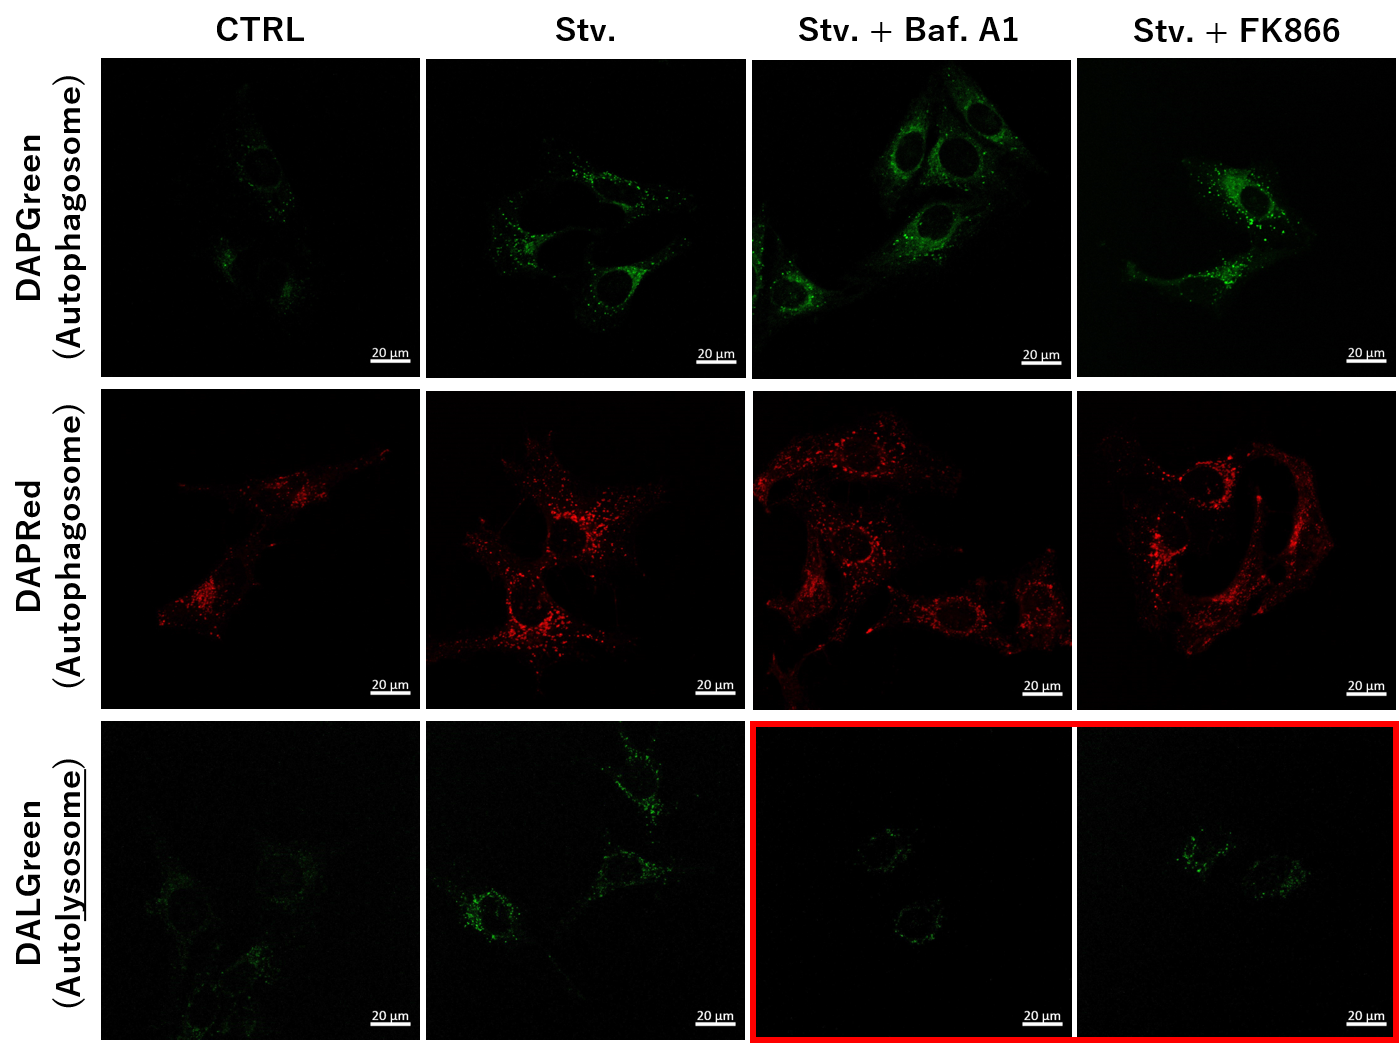
We next determined how FK866-induced lysosomal deacidification affects the autophagy-lysosomal pathway. After staining with DAPGreen/DAPRed (for detecting autophagosome), or DALGreen (for detecting autolysosome), HeLa cells were starved in HBSS incubation and then treated with FK866 or Bafilomycin A1. Under the starvation condition, the fluorescent signals from all dyes increased, indicating the proceeding autophagy-lysosomal pathway. On the other hand, only DALGreen's signals were decreased in FK866 and Bafilomycin A1 treated cells with starvation conditions. These results clearly suggested that FK866 inhibits the autophagy-lysosomal pathway by NAD+ depletion-induced lysosomal deacidification.
ROS research
Separate detection of mitochondrial ROS and intracellular ROS in the same sample
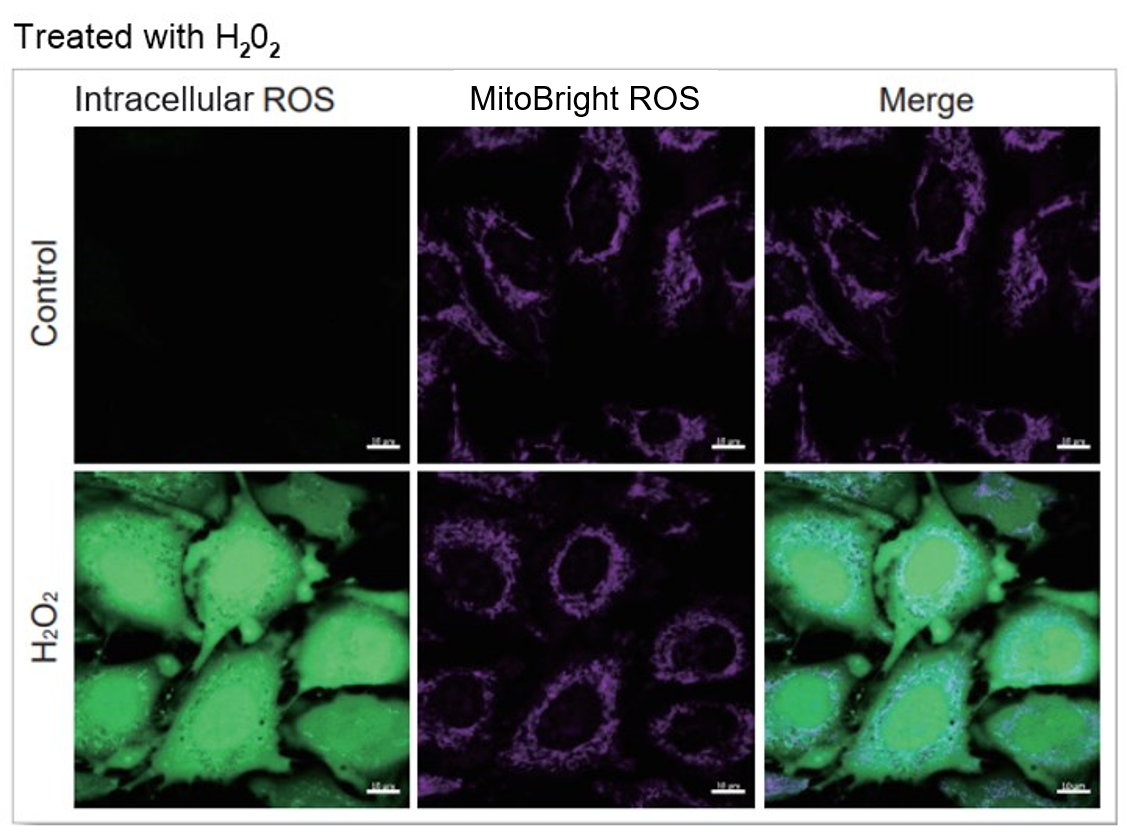
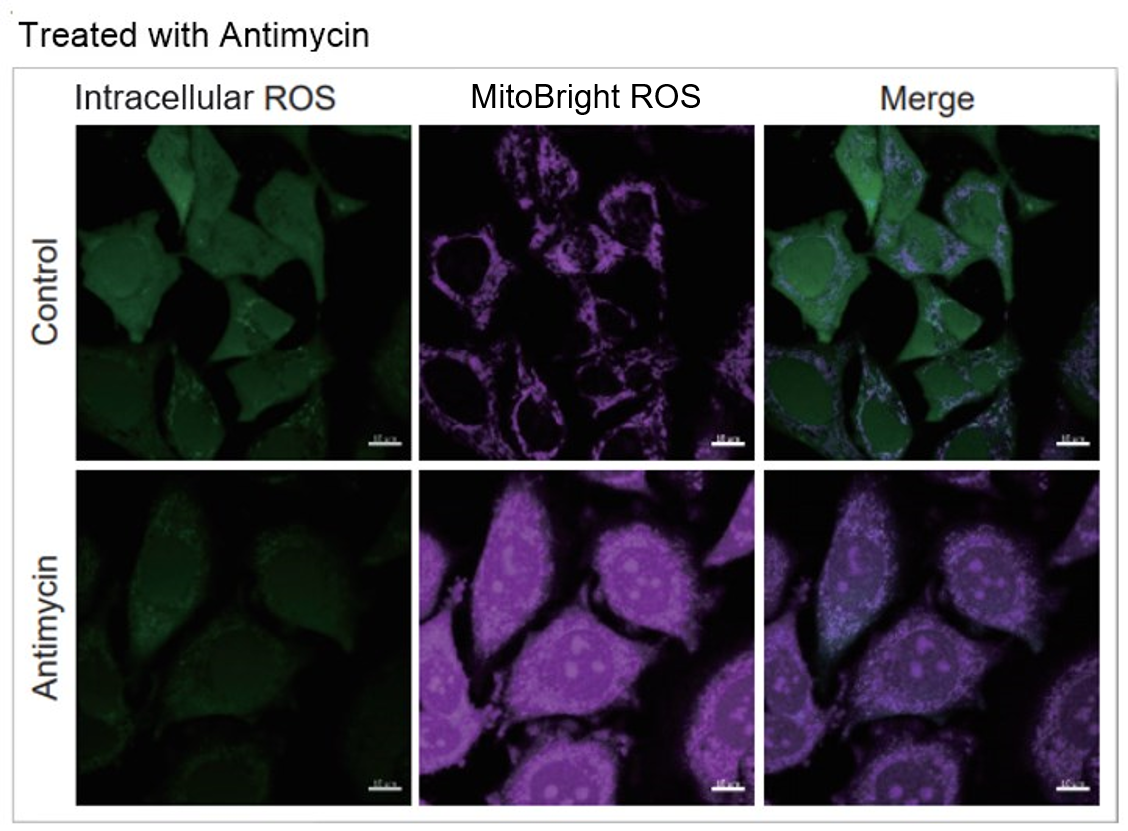
HeLa cells were washed with HBSS and co-stained with MitoBright ROS - Mitochondrial Superoxide Detection and ROS Assay Kit -Highly Sensitive DCFH-DA- (Total ROS detection), and separately treated with mitochondrial superoxide inducer Antimycin or hydrogen peroxide. As a result, intracellular total ROS and mitochondrial superoxide were observed separately.
Protocol

<Imaging Conditions>(Confocal microscopy)
Intracellular ROS: Ex = 488, Em = 490-520 nm
MitoBright ROS: Ex = 633 nm, Em = 640-700 nm
Scale bar: 10 μm
Simultaneously detection of mitochondrial ROS production and lysosomal pH change
Uncoupler, CCCP induces mitochondrial ROS production as well as lysosomal neutralization
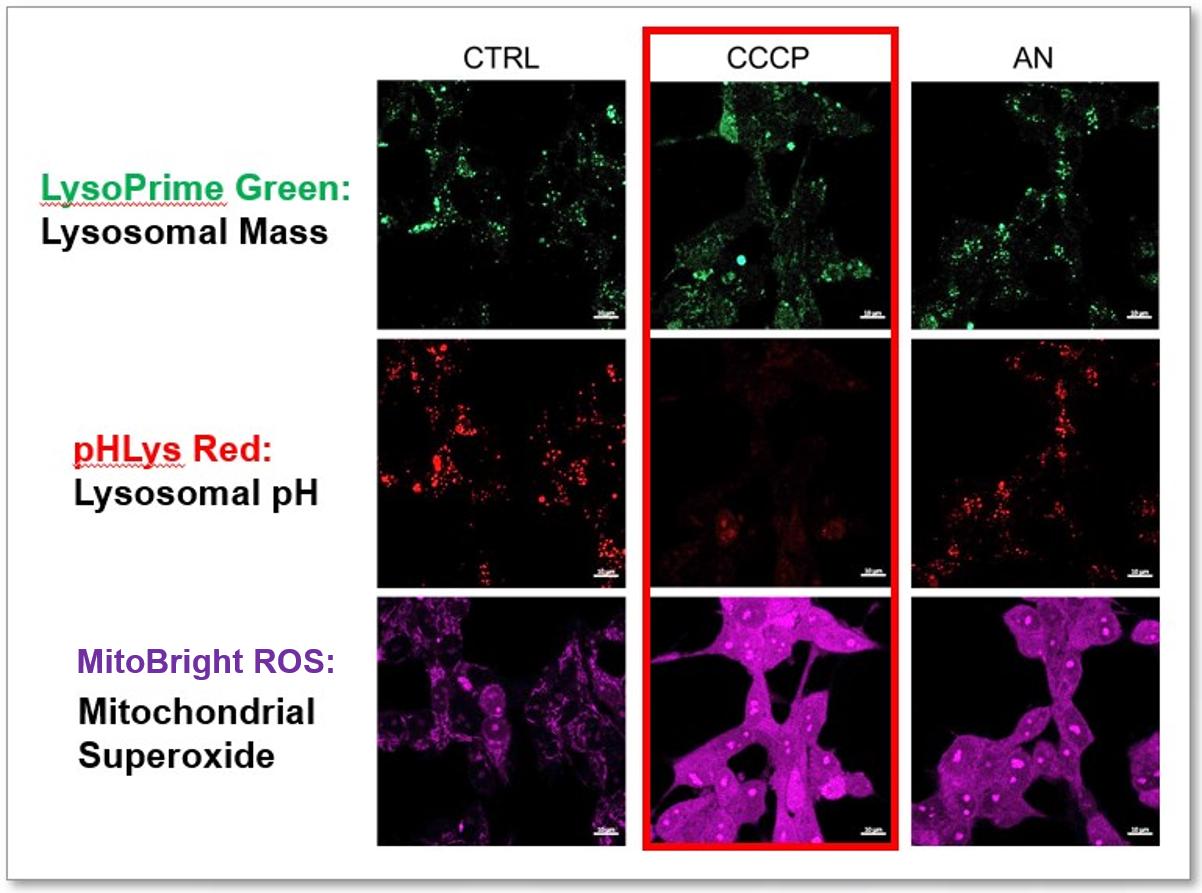
We tried the simultaneous detection of lysosomal and mitochondrial dysfunction in Hela cells treated with CCCP or Antimycin (AN). CCCP and AN are well-known inducers of mitochondrial ROS regarding loss of mitochondrial membrane potential. Rescent research showed the result that CCCP induces not only mitochondrial ROS but also lysosomal neutralization. To detect mitochondrial ROS, HeLa cells were labeled by MitoBright ROS - Mitochondrial Superoxide Detection, and the lysosomal mass and pH were detected separately with LysoPrime Green and pHLys Red (Lysosomal Acidic pH Detection Kit: Bundle kit for pH-sensitive & pH-Resistant Dyes). Co-staining with MitoBright ROS and Lysosomal dyes demonstrated that CCCP causes lysosomal neutralization and mitochondrial ROS induction at the same time.
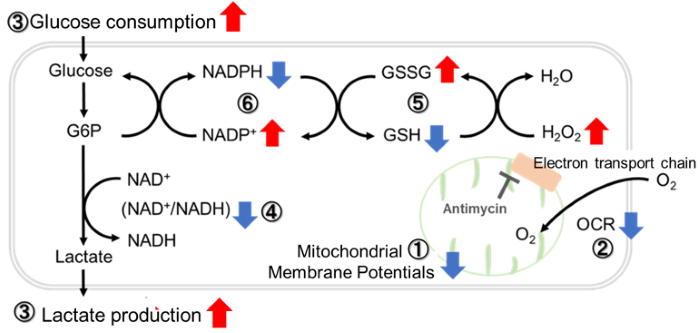
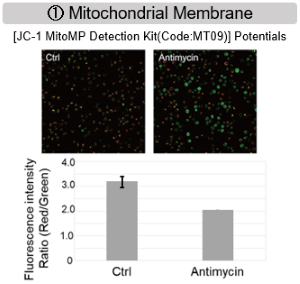
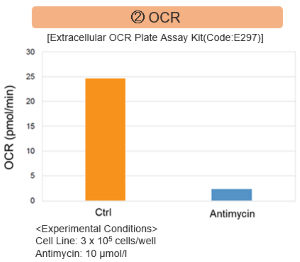
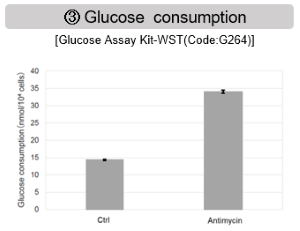
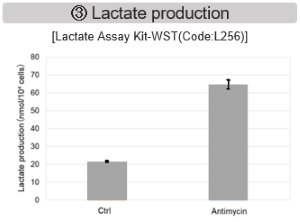
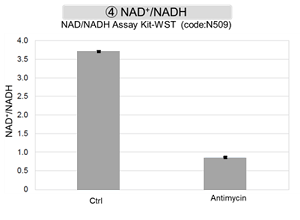
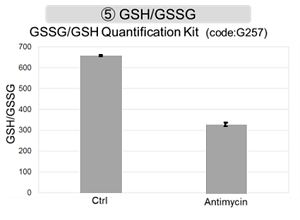
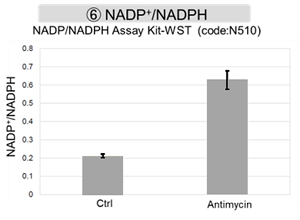
Comprehensive analysis of metabolism in mitochondrial dysfunction
Antimycin stimulation of Jurkat cells was used to evaluate the changes in cellular state upon inhibition of the mitochondrial electron transport chain using a variety of indicators.
The results showed that inhibition of the electron transport chain resulted in (1) a decrease in mitochondrial membrane potential and (2) a decrease in OCR. In addition, (3) the NAD+/NADH ratio of the entire glycolytic pathway decreased due to increased metabolism of pyruvate to lactate to maintain the glycolytic pathway, (4) GSH depletion due to increased reactive oxygen species (ROS), and (6) increase in the NADP+/NADPH ratio due to decreased NADH required for glutathione biosynthesis were observed.
-
 /
/
-
Cystine/glutamate antiporter (xCT) is frequently overexpressed in human cancers and promotes cystine uptake and glutathione biosynthesis. This results in protection from oxidative stress and ferroptosis, a type of programmed cell death dependent on iron and characterized by the accumulation of lipid peroxides. We, therefore, treated A549 cells with erastin to inhibit xCT before evaluating intracellular uptake and redox balance.
As a result, we were able to get three conclusions:
・To compensate for the loss of cysteine, the uptake of amino acids increased.
・The decrease in glucose uptake suggests that metabolic reprogramming may have taken place.
・The decrease in glutathione would have increased Fe2+, ROS, and Lipid peroxides – all hallmarks of Ferroptosis.

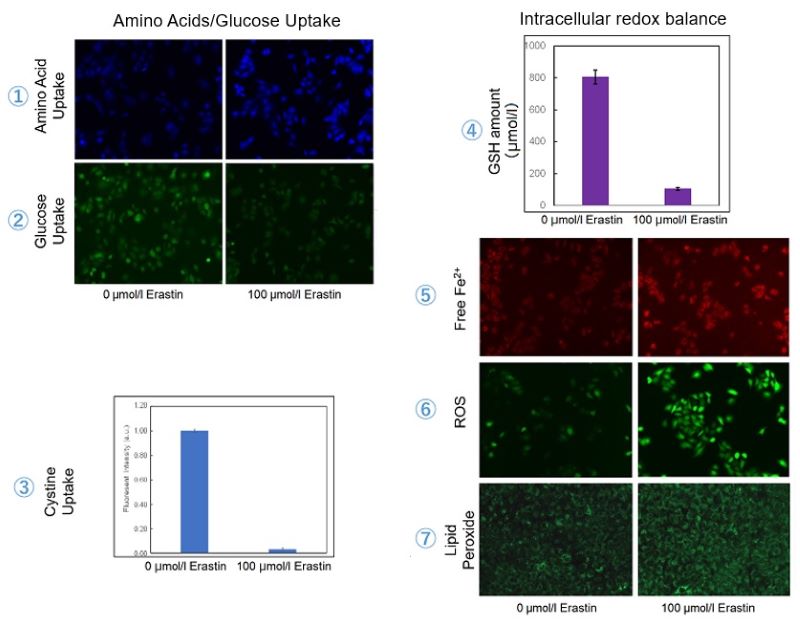
Cell Line: A549
Incubation Conditions: 100 μmol/l Erastin/MEM, 37℃, 3h


