| Cancer cell metabolism is shaped not only by genetic alterations but also by microenvironment-derived metabolites that influence cell fate, epigenetic programs, and treatment responses. Tumor cells exploit nutrient-poor and acidic conditions by rerouting metabolic pathways to sustain proliferation and maintain cellular plasticity. Recent studies have revealed that lactate, produced within tumor tissues, stabilizes stem-like states by epigenetically reinforcing proliferative programs, enabling differentiated cancer cells to reacquire self-renewal capacity. Another recent work shows that acetate released from cancer-associated fibroblasts is converted by ACSS2 into acetyl-CoA, activating transcriptional networks that remodel polyamine metabolism and support cancer cell survival in acidic tumor microenvironments. Together, these findings underscore the emerging concept that microenvironmental metabolites act as regulatory signals that shape tumor behavior beyond their traditional role as metabolic substrates. | ||||||||||||||||||||
|
Lactate controls cancer stemness and plasticity through epigenetic regulation (Cell Metabolism, 2025) Highlighted technique: Human tumor organoids were engineered to express genetically encoded FRET-based metabolic sensors reporting NAD⁺/NADH redox state, intracellular lactate, and glucose dynamics. Time-lapse 3D imaging was analyzed using the authors’ machine-learning-based single-cell tracking software CellPhenTracker, enabling quantitative reconstruction of differentiation and dedifferentiation dynamics at true single-cell resolution. Related technique Lactate Assay, Glycolysis/OXPHOS Assay |
||||||||||||||||||||
|
Cancer-associated fibroblast-derived acetate promotes pancreatic cancer development by altering polyamine metabolism via the ACSS2–SP1–SAT1 axis (Nature Cell Biology, 2024) Related technique Cell Proliferation Assay, Cytotoxicity Assay |
||||||||||||||||||||
Metabolic Activity Assays (click to open/close)
|
||||||||||||||||||||
Application Note I (click to open/close)
|
||||||||||||||||||||
|
|
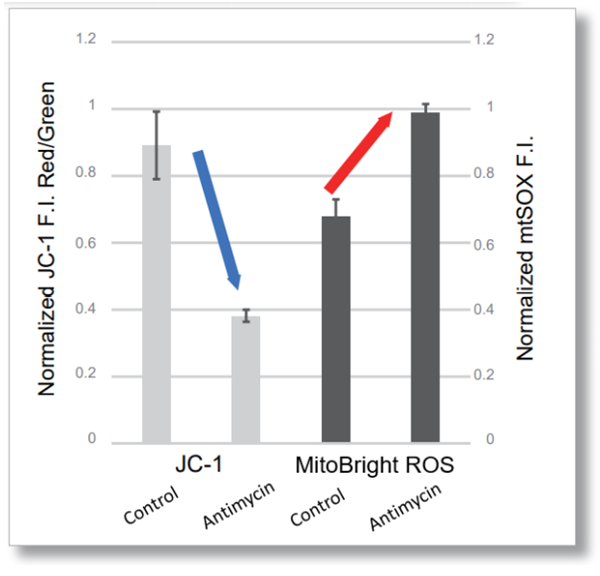
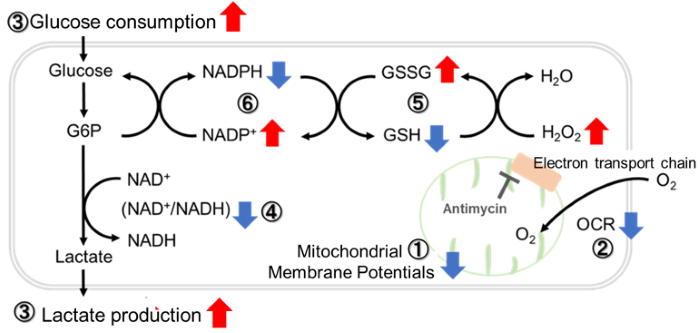
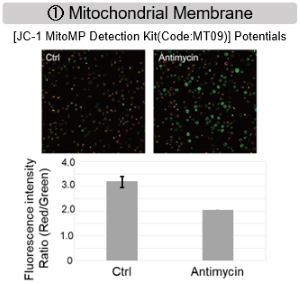
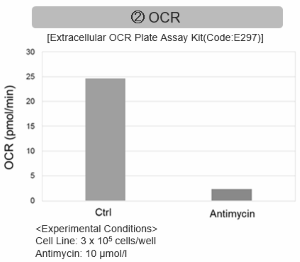
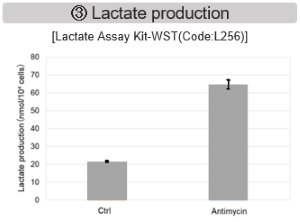
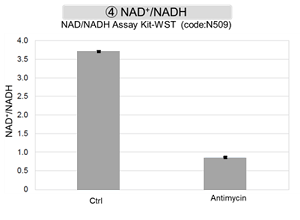
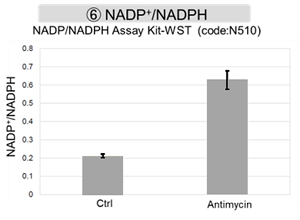
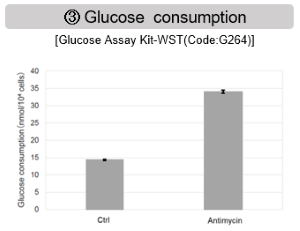
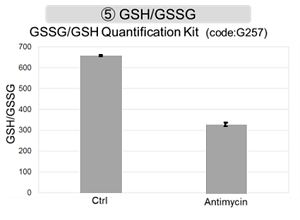
Antimycin stimulation of Jurkat cells was used to evaluate the changes in cellular state upon inhibition of the mitochondrial electron transport chain using a variety of indicators. The results showed that inhibition of the electron transport chain resulted in (1) a decrease in mitochondrial membrane potential and (2) a decrease in OCR. In addition, (3) the NAD+/NADH ratio of the entire glycolytic pathway decreased due to increased metabolism of pyruvate to lactate to maintain the glycolytic pathway, (4) GSH depletion due to increased reactive oxygen species (ROS), and (6) increase in the NADP+/NADPH ratio due to decreased NADH required for glutathione biosynthesis were observed.
|
Application Note II (click to open/close)
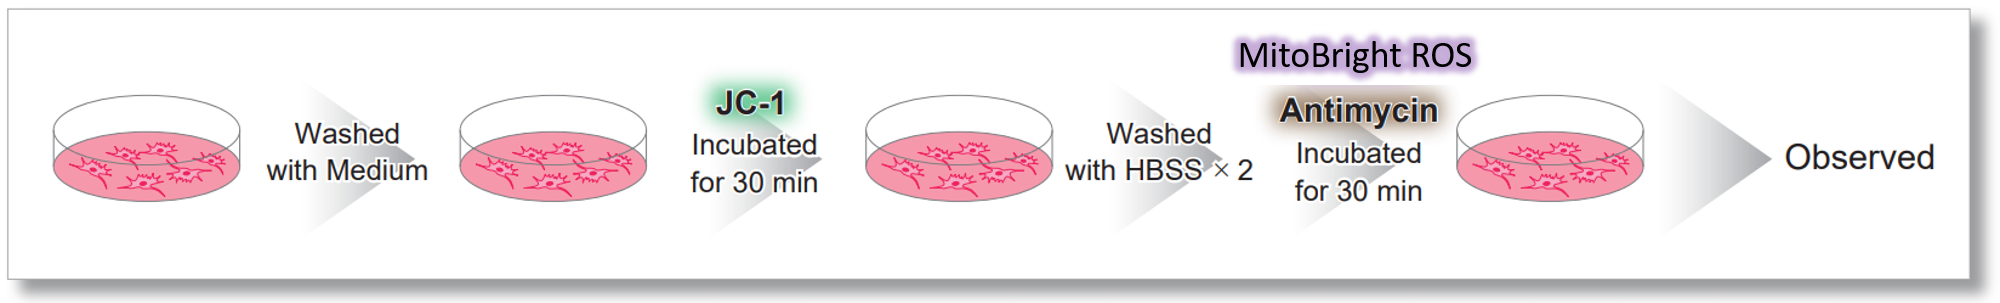
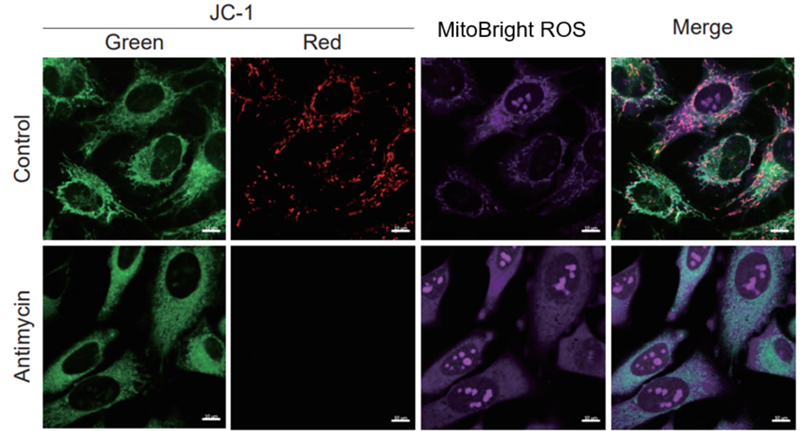
> Tracking ROS and Membrane Potential Decline
| After HeLa cells were washed with HBSS, co-stained with MitoBright ROS Deep Red and mitochondrial membrane potential staining dye (JC-1: code MT09), and the generated mitochondrial ROS and membrane potential were observed simultaneously. As a result, the decrease in mitochondrial membrane potential and the generation of mitochondrial ROS are simultaneously observed. | |
|
<LEFT: Imaging Conditions>(Confocal microscopy) <Right: Examination Conditions>(Plate Reader)Tecan, Infinite M200 Pro |