Previous Science Note
| Recent studies have drawn attention to intercellular mitochondrial transfer in cancer. Tumors have been reported to promote intratumoral innervation through neurotrophic factors, and recent work shows that mitochondria supplied by neurons shift cancer cell metabolism and are linked to increased metastatic potential. Moreover, for cancer-associated fibroblasts (CAFs), known supporters of tumor progression, transfer of mitochondria from cancer cells has been shown to induce CAF differentiation, deepening our understanding of intercellular mitochondrial transfer as a strategy in cancer. | ||||||||||||||||||||||||
|
Nerve-to-cancer transfer of mitochondria during cancer metastasis (Nature, 2025) Highlighted technique: MitoTRACER is a genetic switch built into cancer cells, containing a reporter with DsRed and eGFP. The cells normally fluoresce red, but when they receive mitochondria carrying Cre recombinase from neurons, Cre edits their DNA to switch fluorescence from red to green. This irreversible change is inherited by daughter cells, enabling permanent lineage tracing of cancer cells that acquired neuronal mitochondria. Related technique Mitochondria Detection, Glycolysis/OXPHOS Assay |
||||||||||||||||||||||||
|
MIRO2-mediated mitochondrial transfer from cancer cells induces cancer-associated fibroblast differentiation (Nature Cancer, 2025) Highlighted technique: The authors isolated mitochondria from cancer cells and transplanted them into fibroblasts, directly testing whether mitochondria alone could reprogram fibroblasts into CAF-like cells. Using Seahorse assays, they showed that the transplanted mitochondria increased oxidative phosphorylation (OCR) and ATP production, confirming a functional metabolic shift in recipient fibroblasts. Related technique OCR Plate Assay, ATP Assay |
||||||||||||||||||||||||
Related Techniques (click to open/close)
|
||||||||||||||||||||||||
Application Note I (click to open/close)
|
||||||||||||||||||||||||
|
|
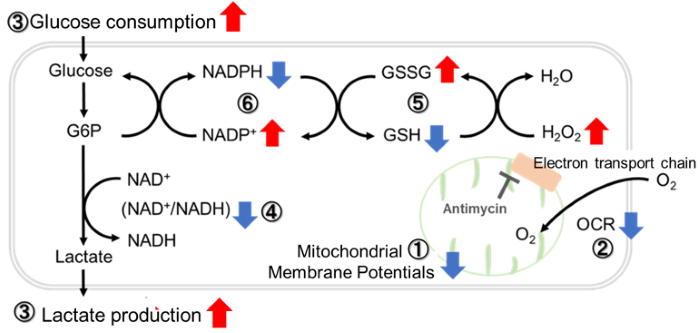
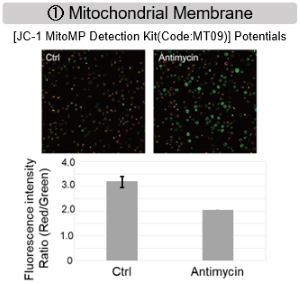
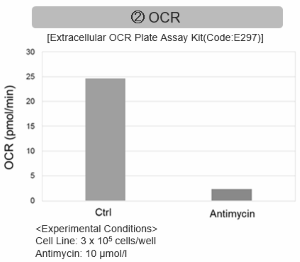
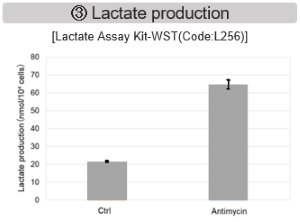
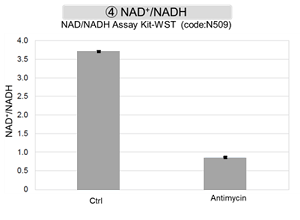
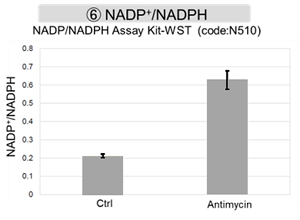
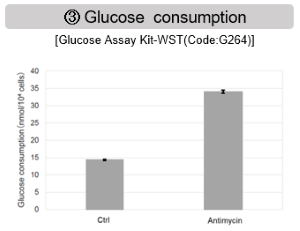
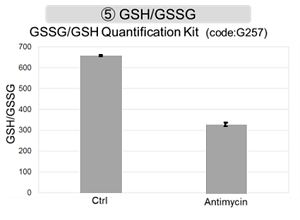
Antimycin stimulation of Jurkat cells was used to evaluate the changes in cellular state upon inhibition of the mitochondrial electron transport chain using a variety of indicators. The results showed that inhibition of the electron transport chain resulted in (1) a decrease in mitochondrial membrane potential and (2) a decrease in OCR. In addition, (3) the NAD+/NADH ratio of the entire glycolytic pathway decreased due to increased metabolism of pyruvate to lactate to maintain the glycolytic pathway, (4) GSH depletion due to increased reactive oxygen species (ROS), and (6) increase in the NADP+/NADPH ratio due to decreased NADH required for glutathione biosynthesis were observed.
|
Application Note II (click to open/close)
> Tracking ROS and Membrane Potential Decline
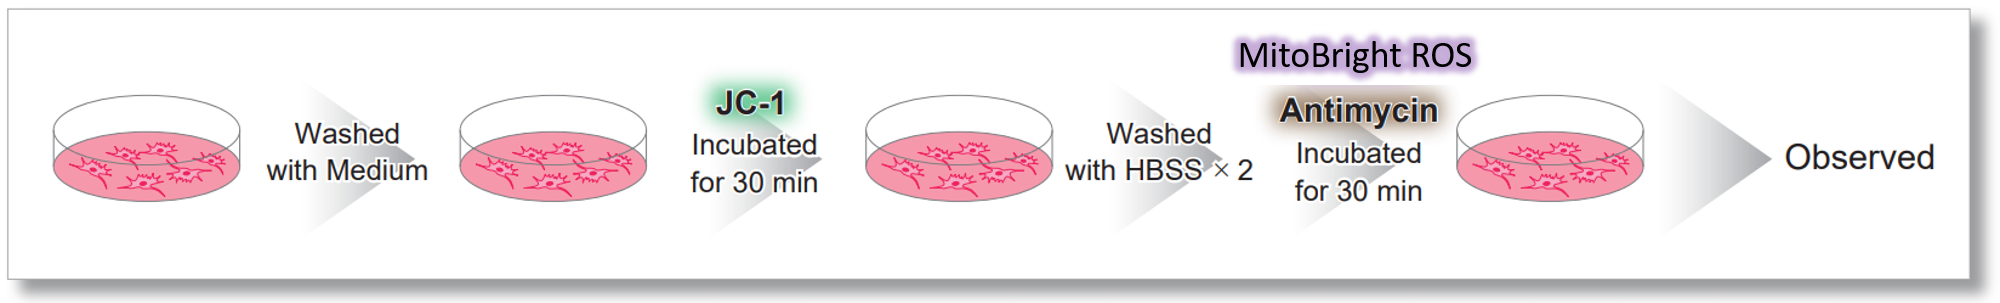
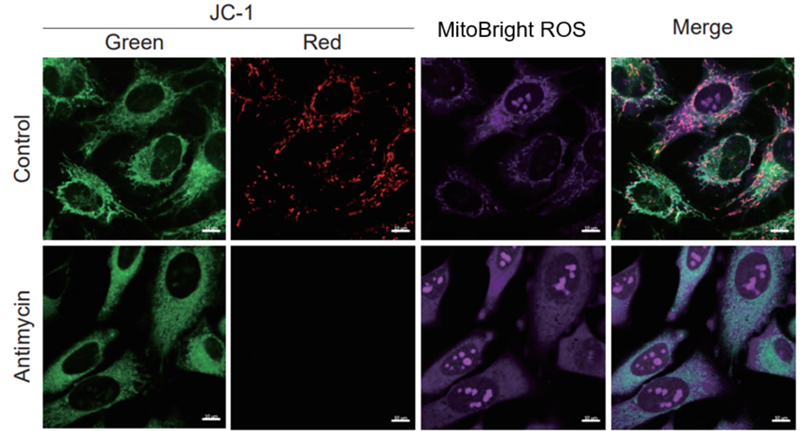
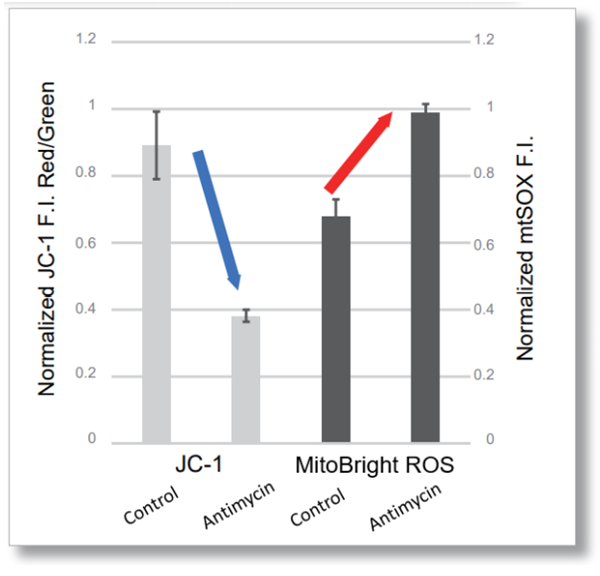
| After HeLa cells were washed with HBSS, co-stained with MitoBright ROS Deep Red and mitochondrial membrane potential staining dye (JC-1: code MT09), and the generated mitochondrial ROS and membrane potential were observed simultaneously. As a result, the decrease in mitochondrial membrane potential and the generation of mitochondrial ROS are simultaneously observed. | |
|
<LEFT: Imaging Conditions>(Confocal microscopy) <Right: Examination Conditions>(Plate Reader)Tecan, Infinite M200 Pro |