

|
Hepatic lipid droplets require lysosomal turnover to limit lipid storage under nutrient stress, and lipophagy plays a central role in lipid droplet clearance in fatty liver disease. Two recent studies have examined the molecular mechanisms underlying this process. One study demonstrated that TMEM55B deficiency impairs lysosomal lipid degradation and mitochondrial quality control, linking these defects to MASLD/MASH progression. Another showed that Rubicon silencing restores autophagosome-lysosome fusion and lipophagy, offering a potential avenue for therapeutic intervention. |
||||||||||||||||||||||||||||||||||||
|
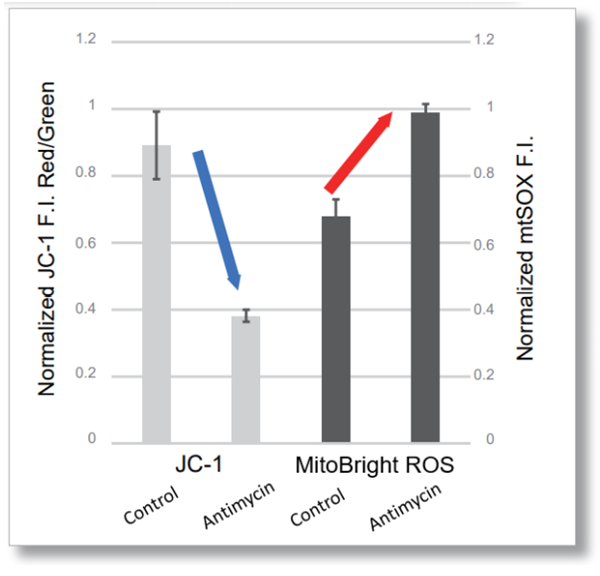
Loss of TMEM55B modulates lipid metabolism through dysregulated lipophagy and mitochondrial function (Cell Death & Disease, 2026) Highlighted technique: There is an OCR plate-assay kit that requires fewer cells and offers lower running costs. It can also be used for preliminary evaluation prior to Seahorse analysis. |
||||||||||||||||||||||||||||||||||||
|
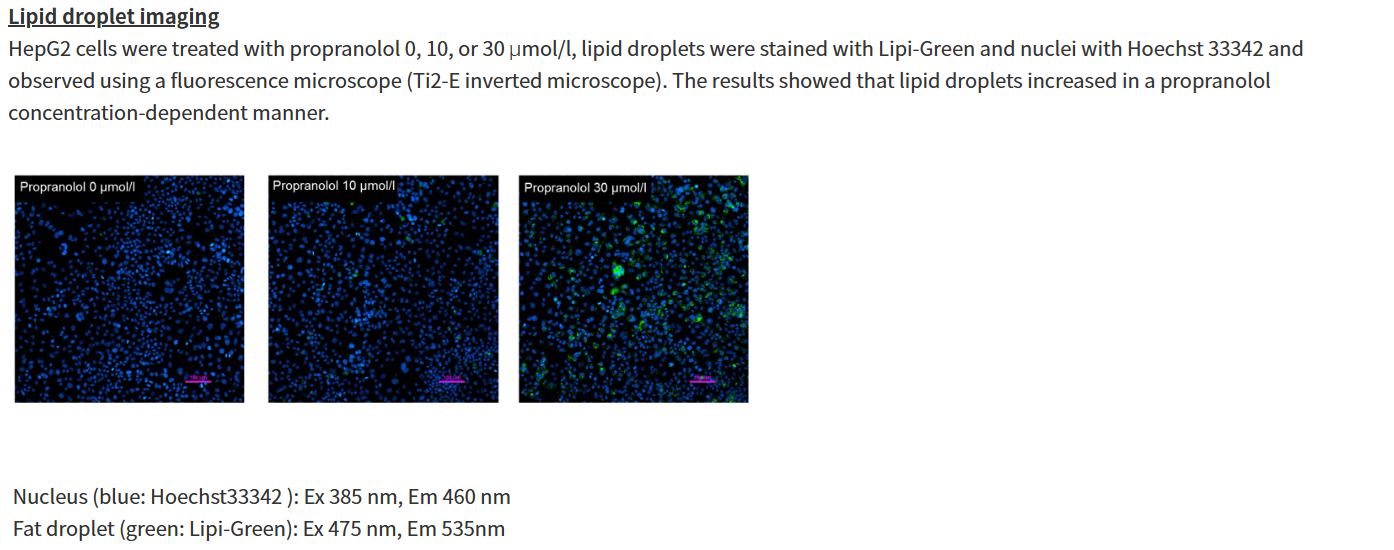
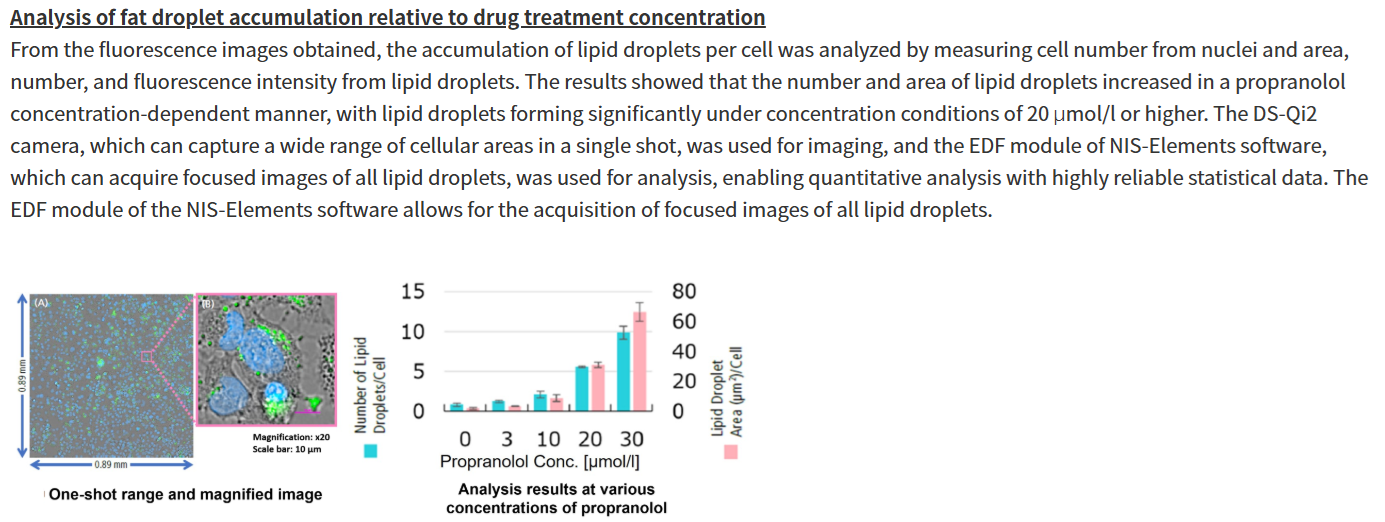
Dual-targeted siRubicon delivery strategy triggers hepatocellular lipophagy for mitigating liver steatosis (Nature communications, 2025) Highlighted technique: Visualize lipid droplet dynamics with bright, multicolor probes for live- and fixed-cell imaging. For lysosomal analysis, pH-independent probes assess lysosomal quantity, while pH-sensitive probes detect changes in lysosomal pH. |
||||||||||||||||||||||||||||||||||||
Lipid Metabolism, Mitochondria and Lysosome Indicators (click to open/close)
|
||||||||||||||||||||||||||||||||||||


Product Classification
Product Classification
-
Cell Proliferation / Cell Cytotoxicity Assay
Cell Proliferation / Cell Cytotoxicity Assay Kits /Related Reagents
-
Cell Staining
Cell Double Staning Kit /Live Cell Staining /Dead Cell Staining /Nuclear Staining /Mitochondria Staning /Tissue Staining /Nucleolus Staining /Lipid Droplet Staining /Cell Membrane Staining /Lysosome Staining
-
Intracellular Fluorescent Probes
Reagents for Intracellular Calucuum Ion /Reagents for Intracellular Ion /Related Reagents
-
Labeling Chemistry
Protein Labeling Kits /Protein Labeling Reagents /HPLC Derivertization Reagents /Biotion Labeling Reagents /Related Reagents /Exsosome Labeling
-
Oxidative Stress
Stress Maker Detection /NO Detection /NO Donor /NO Inhibitor /ACE Inhibition Assay /Reagents・Kits for Sulfur Biology /Antioxidant Assay Kit /Donors for Sulfur Biology
-
-Bacstain- Series
Bacterial Proliferation Assay Kit /Bacteria Staining /Bacterial Fluorescent Staining
-
Molecular Biology
Transfection Reagents /Nuclear Staining /Agarose /Related Reagents /Buffer for Molecular Biology
-
Detergents
Detergents /Sets
-
Cross-Linking Reagents
Hetero-bifunctional Reagents /Homo-bifunctional Reagents /Others
-
Redox Dyes
Reductive Chromogenic Dyes /Electron Mediators /Oxidative Chromogenic Dyes /Trinder Reagents
-
Ion Analysis
Ionophores /Anion Eliminator /Solvent for Ion Electrode of Liquid Film Type
-
Organic Scintillator
-
Buffers
Buffers
-
Metal Chelates
EDTA /Other Chelator /Reagents for Chelator Titration
-
Chromogen/Metal Indicator
Chromogen/Metal Indicator
-
Water Analysis
/Fluorine /Iron / /Water Hardness /Residual Chlorine /ABS /Cyan / /Chromium /Copper
-
Extraction Reagent
AA Chelator /Related Reagents
-
High Purity Solvent
Spectrozole /Luminazole / /Acnazole /Dehydration Solvent for Synthesis
-
Biochemicals
Biochemicals
-
Functional Organic Material
Alkanethiol Derivative /Phosphonic Acid Derivatives
